Northern, rural schools at a disadvantage
Results from People for Education’s 19th Annual School Survey raise significant questions about the impact of geography on students’ equitable access to education.
Students living in small towns, rural and Northern communities are less likely to have music or health and physical education teachers, have less access to psychologists, and are more likely to attend schools that put caps on waiting lists for special education.
People for Education’s 2016 Annual Report on Ontario’s Publicly Funded Schools – based on survey results from 1154 elementary and secondary schools across Ontario – recommends a review of Ontario’s funding formula in order to address the inequities.
THE RURAL /URBAN DIVIDE
This year’s report examines differences between resources and programs in small town/rural schools compared to urban/suburban schools. Because most education funding is allocated according to enrolment, small town and rural boards – which are more likely to have smaller schools – may be at a disadvantage.
In 2016:
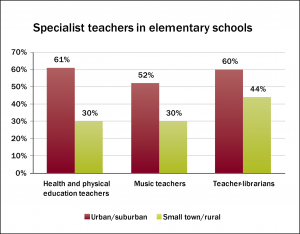
- 61% of urban/suburban elementary schools have a health and physical education teacher, compared to 30% of small town/rural schools;
- 52% of urban/suburban schools have a music teacher, compared to 30% of small-town/rural schools;
- 60% of elementary schools in urban/suburban areas have a teacher-librarian, compared to 44% of small town/rural schools;
- 94% of urban/suburban secondary schools have a full-time guidance teacher, compared to 74% of small town/rural schools; and
- 62% of urban/suburban elementary schools have regular access to social workers, compared to 30% of small-town/rural schools.
IMPROVEMENTS IN HEALTH AND PHYSICAL EDUCATION
Over the past 10 years, the province has introduced a number of policies to support students’ physical and emotional health. This focus on students’ health appears to have had an impact on schools’ access to a range of specialists:
In 2016:
- 48% of elementary schools have a health and physical education teacher, a fairly steady upward trend from 40% in 2009.
- 50% of elementary and 76% of secondary schools have access to a regularly scheduled social worker, compared to 43% of elementary and 63% of secondary schools in 2012.
- 37% of elementary and 53% of secondary schools have access to a regularly scheduled child and youth worker, compared to 33% of elementary and 51% of secondary schools in 2012.
To read the press release, click here.
To read the report, click here.
To read comments from Andrea Walden, family farm operator, click here.

