This report, based on the results from our annual school survey, identifies equity issues related to fundraising and fees in Ontario’s publicly funded schools. Fundraising inequities appear to be growing, despite the introduction of provincial fundraising guidelines in 2012.
Quick facts:
- 99% of elementary schools and 87% of secondary schools report fundraising
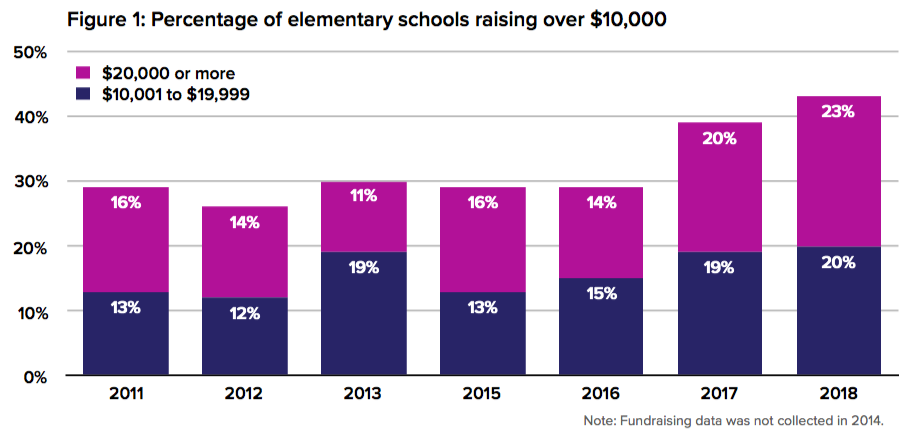
- Almost a quarter of elementary schools raise $20,000 or more – the highest proportion in the survey’s history
- Elementary schools with lower rates of poverty raise twice the amount of money raised in schools with higher rates of poverty
- 87% of secondary schools report having student activity fees, which can be up to $300 per year
Fundraising is a staple of most schools in Ontario. In 2018, 99% of elementary and 87% of secondary schools report that they fundraise in some way. Schools report a variety of fundraising activities, including pizza lunches, book fairs, bingos, holiday gift sales, and chili cook-offs. The money raised is used to support charities, fund busing for school trips, purchase new technology, establish student bursaries and scholarships, or add outdoor learning spaces.
Ontario’s Guideline for School Fundraising specifies that funds raised must be used “to complement, not replace, public funding for education”(Ontario, 2012, p. 3). Schools cannot fundraise for “learning materials and textbooks,” “staff training for professional development,” or “administrative expenses” (p. 4). But they can fundraise for things like “excursions,” “guest speakers,” “extracurricular activities,” and “upgrades to sporting facilities” (pp. 4-5).
These experiences enrich the school environment, and help students develop skills and competencies they might not get from classroom learning alone (Upitis, 2014).
We are thankful for the hard work and contributions of our parent community. Without their continued efforts, a lot of the extracurricular activities, guest speakers/presenters and special events that take place…could not happen with the current school budget alone.
Elementary school,
Toronto DSB
While the median amount fundraised per secondary school has remained fairly consistent in recent years, there has been a substantial increase in the median amount raised in elementary schools.
In 2018, the median amount raised by elementary schools reached an all-time high of $10,000, 25% higher than any other year on record. Almost a quarter of elementary schools raised $20,000 or more, which is also an all-time high, increasing from 16% in 2011 (see Figure 1).

Fundraising inequities have been a persistent issue in Ontario (Winton, 2016). And these inequities appear to be growing, despite the introduction of provincial fundraising guidelines in 2012.
This year’s survey results show that once again, the amount fundraised by school communities varies widely. In 2018, the top 10% of fundraising elementary schools raised 37 times the amount raised by the bottom 10%, with some schools reporting raising as much as $123,000.
Our school raises only a fraction of what other more affluent schools raise. It does have an effect on what we can/cannot do and support.
Elementary school,
Waterloo Catholic DSB
Among secondary schools, the top 5% of fundraising schools raised as much as the bottom 81% combined, with some schools reporting raising $150,000.
From their comments on the surveys, it is clear that principals are acutely aware of such variations and their consequences.
Fundraising results in Have and Have Not [schools]… We do not have field trips and performances in school on a par with other wealthier schools… We have to spend a great deal of time sourcing community partnerships to make up for lack of funds.
Elementary school
York Region DSB
This year, we used information from Statistics Canada and Ontario’s Ministry of Education to look at the percentage of students from each school whose families’ after-tax income is below the Low-Income Measure. Using our survey sample of elementary schools, People for Education compared the top quartile on this measure – which we refer to as high poverty schools – and the bottom quartile – referred to as low poverty schools.
In high poverty schools, the median amount fundraised was half that of low poverty schools ($6,000 compared to $12,000 per school). The amount fundraised per pupil also differed considerably: the average was $27 per student in high poverty schools compared to $44 in low poverty schools.
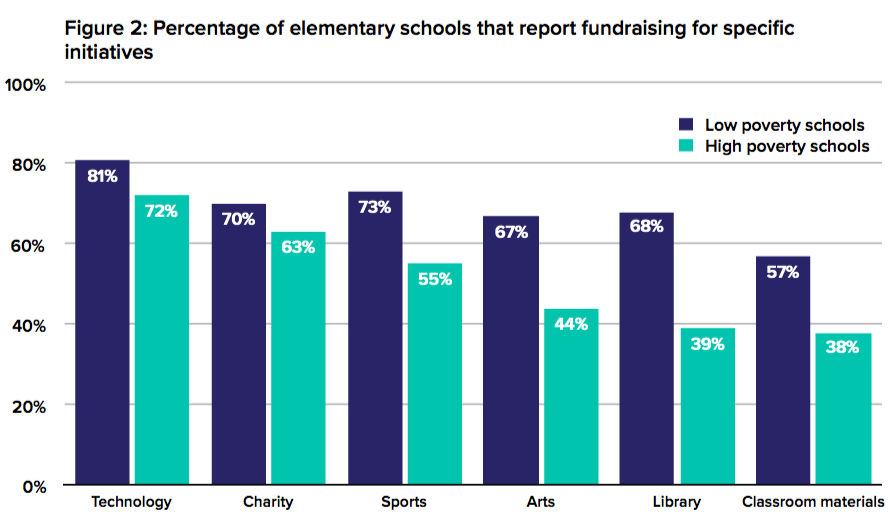
The survey findings also show that family income affects what schools fundraise for (see Figure 2). These differences are most apparent in fundraising for school libraries and the arts.

Extracurricular activities are often associated with better learning (Farb & Matjasko, 2012) and well-being (Ferguson & Powers, 2014) among students. Most secondary schools offer a wide variety of extracurricular activities and sports programs, and most of these programs have costs associated with them that are not covered by school budgets.
Many secondary schools rely on student fees to cover the cost of enrichment activities. In 2018, 87% of secondary schools report charging student activity fees. While the average activity fee is $46 per student per year, schools report fees ranging from $2 to $300 per year.
As a principal, I’m constantly having to subsidize for athletics. Students that can’t afford the fees, transportation costs continue to increase, referee fees continue to increase and costs for being successful (playoffs, OFSAA) are also increasing. Our budgets aren’t.
Secondary school,
Peel DSB
The Fees for Learning Materials and Activities Guideline states: “Every student has the right to attend a school, where they are a qualified resident pupil, without the payment of a fee.” (Ontario, 2011, p. 1). While the vast majority of secondary schools report that they charge activity fees, many principals commented that the fees are voluntary.
Athletic fees can be much higher than activity fees, with some secondary schools charging up to $1200. Eighty percent of secondary schools report charging athletic fees in 2018, and the average fee is $94.
Secondary schools in urban/suburban areas are more likely to charge student activity fees, but less likely to charge a fee for athletics than secondary schools in rural areas (see Figure 3). The average amount charged follows a similar pattern. In terms of student activity fees, the average amount charged by secondary schools in urban areas is $50, compared to $40 in rural areas. However, the average athletic fee in urban areas is $88, compared to $103 in rural areas.

This may be, at least in part, due to the increased transportation costs for remote schools traveling to and from games and sports competitions. In their comments, principals report that busing and transportation are costly and contribute to the need for fees, especially in rural areas.
Because we are a rural school, sports teams have to travel, so busing impacts the costs greatly.
Secondary school,
Upper Grand DSB
At our school the voluntary school fee is only collected from 5% of the total population. For athletic fees we tend to collect from 33% of the entire roster.
Secondary school,
Ottawa-Carleton DSB
While it is clear from principals’ comments, and from extensive research, that fundraising can be an effective component of community engagement (Winton, 2016), it also raises significant questions about equity in the system.
Research has shown that when children enter school, there is a “competency gap” between students from high and low socio-economic status backgrounds in areas such as physical health and well-being, social competence, emotional maturity, language and cognitive development, and communication skills and general knowledge (Janus & Duku, 2007). Providing enriched learning opportunities and extra-curricular activities – along with system-wide emphasis on vital competencies beyond reading, writing and mathematics – can close this “competency gap.”
The wealthier communities receive many donations from families, so it is easier to manage their school budget. Therefore, students from well-off families have a school filled with new tools and equipment while schools with students from poorer families have to wait much longer to raise money to reach their goal.
Elementary school,
CSD catholique de l’Est ontarien
[Translated from French]
As cited earlier, enrichment experiences help students develop skills and competencies they might not get from classroom learning alone (Upitis, 2014). However, our survey results show that principals often rely on fundraising and fees to provide these learning experiences, and schools with higher rates of poverty, where fundraising is lower, may not be able to provide the same level of enrichment as their wealthier counterparts.
Students at high-poverty schools may be facing a triple disadvantage:
- Many may be starting school with a “competency gap.”
- The schools they are entering are likely to raise less money, and therefore are less able to provide the resources and enriched learning opportunities that can help close that gap.
- Their families may not be able to provide these opportunities outside of school.
And therein lies the wicked problem of fundraising.
Parents want to provide the best opportunities for their children. But if the system is to provide every child with an equitable chance for success, it is vital that all students – not just those whose parents can afford it – have access to the programs, resources, and activities that build vital competencies for long-term success.
Farb, A.F. & Matjasko, J.L. (2012). Recent advances in research on school-based extracurricular activities and adolescent development. Developmental Review 32(1), 1-48.
Ferguson, B. & Powers, K. (2014). Broader measures of success: Physical and mental health in schools. In Measuring What Matters. Toronto, ON: People for Education.
Janus, M. & Duku, E. (2007). The school entry gap: Socioeconomic, family, and health factors associated with children’s school readiness to learn. Early Education and Development, 18(3), 373-403.
Ontario Ministry of Education. (2011). Fees for Learning Materials and Activities Guideline. Toronto, ON: Government of Ontario.
Ontario Ministry of Education. (2012). Guideline for School Fundraising. Toronto, ON: Government of Ontario.
Upitis, R. (2014). Creativity: The state of the domain. In Measuring What Matters. Toronto, ON: People for Education.
Winton, S. (2016). The normalization of school fundraising in Ontario: An argumentative discourse analysis. Canadian Journal of Educational Administration and Policy 180, 1-32.
Author
Max Antony-Newman
Document Citation
People for Education (2018). Fundraising and fees in Ontario’s schools. Toronto: People for Education.
