People for Education's Annual report on Ontario’s publicly-funded schools is an audit of the education system – a way of keeping track of the impact of funding and policy choices in schools across the province. The report is based on survey responses from over 1100 principals in English, Catholic and French schools across the province.
Highlights from the People for Education Annual Report on Ontario’s Publicly Funded Schools 2016
Health
- 48% of elementary schools have a health and physical education teacher.
- 61% of urban/suburban elementary schools have a health and physical education teacher, compared to 30% of small town/rural schools.
- 50% of elementary and 76% of secondary schools report having a regularly scheduled social worker.
Arts
- 43% of elementary schools have a music teacher, either full- or part-time.
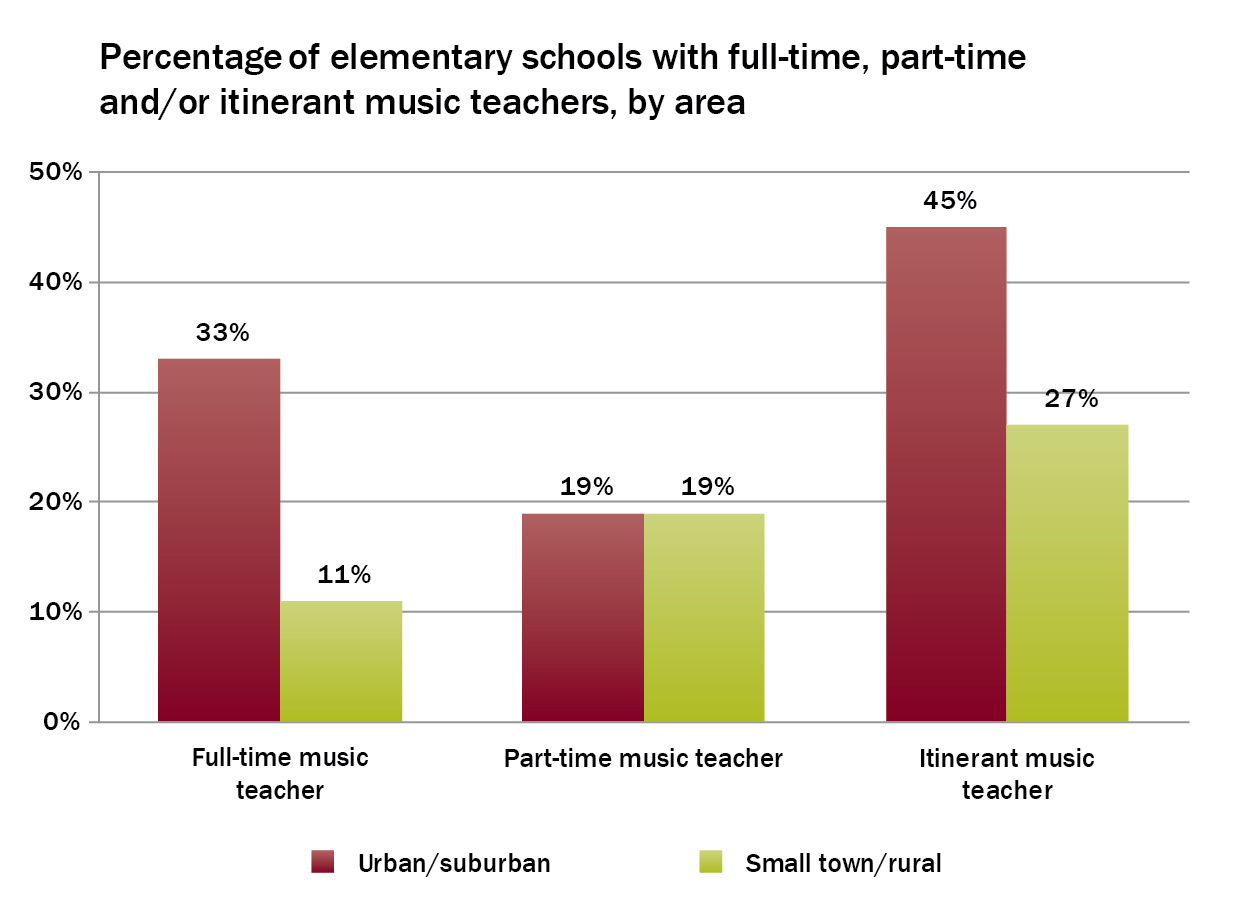
- 33% of urban/suburban elementary schools have a full-time music teacher, compared to 11% in small town/rural schools
Libraries
- only 54% of elementary schools have teacher–librarians, and only 10% have a full-time teacher–librarian.
- only 55% of secondary schools report a full-time teacher–librarian.
- 60% of elementary schools in urban/suburban communities report having a teacher–librarian, compared to 44% of small town/rural schools.
Guidance
- 99% of all secondary schools report having a guidance counsellor.
- only 25% of elementary schools with grades 7 and 8 have a guidance counsellor, either full- or part-time.
- 94% of urban/suburban secondary schools have a full-time guidance counsellor, compared to 74% of small town/rural schools.
Special Education
- An average of 17% of students in each elementary school, and 27% of students in each secondary school receive any assistance from the special education department.
- 59% of elementary and 52% of secondary schools report that there are restrictions on the number of students they can place on waiting lists for assessments.
- 91% of urban/suburban elementary schools report having a full-time special education teacher, compared to 66% in small town/rural schools.
Indigenous Education
- 29% of elementary schools and 49% of secondary schools had indigenous guest speakers.
- 31% of elementary schools and 53% of secondary schools offer professional development opportunities on indigenous cultural issues to staff.
Quick Facts
- 95% of Ontario’s students attend public school.
- 97% of elementary schools and 98% of secondary schools have a full-time principal.
- 45% of elementary schools and 93% of secondary schools report having a vice principal.
Ontario’s public education system is one of the most successful and high-performing systems in the world. Internationally recognized for its commitment to equity, achievement, and inclusivity, Ontario has inspired and informed education policies around the globe. But the considerable disparity between Ontario’s schools in staffing, resources, and learning opportunities remains an ongoing concern.
This year, the province will spend $22.8 billion1 to educate nearly two million students in schools across a wide range of settings: from small schools in remote, rural locations to large schools in urban areas. Providing an enriched learning experience for all students, including arts, health, music, and Indigenous education, and serving the needs of a diverse school system and its students is an enormous undertaking.
This year’s Annual Report on Ontario’s Publicly Funded Schools looks at the resources, staff, and learning opportunities in schools. The report is based on survey responses from 1,154 schools with nearly 500,000 students. Each of Ontario’s 72 publicly funded school boards is represented in the sample.
There are some areas of improvement this year. The percentage of elementary schools reporting a vice principal has risen from 42% in 2011 to 45% this year, and more schools report having health and physical education teachers, social workers, and child and youth workers.
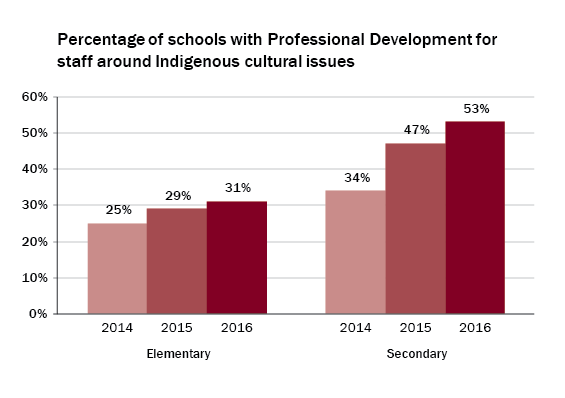
There are also improvements in Indigenous education. Since 2012, the percentage of schools reporting they have professional development for staff on Indigenous cultural issues has increased from 34% to 53% in secondary schools, and from 25% to 31% in elementary schools. However, in order to ensure that all students have access to a rich Indigenous education, it is important that the province act on all of the Calls to Action from the Truth and Reconciliation Commission of Canada that pertain to the changes needed in public education.
While there are some areas of improvement, we are also seeing cuts to important specialist positions, such as elementary teacher-librarians. In addition, elementary schools in rural areas and small towns are less likely to have access to health and physical education, music, and arts teachers when compared to schools in urban/suburban locations.
There have also been significant changes to funding in areas such as special education and Indigenous education over the past few years. While the changes may result in improved access and more effective programs, it will be important for the province to evaluate the impact of the changes on an ongoing basis.
There is extensive evidence2 that a broadly based education, with diverse opportunities for learning, provides students with an equitable chance for success—one of the key goals of public education. In this year’s report, the decline and disparities in access to programs and specialists in arts, health and physical education, and libraries challenge the ideal of a broadly based public education system. In order to provide all students with access to a wide range of learning opportunities—regardless of the size of their schools or their location—the province must work with school boards and communities to ensure that appropriate funding and policy is in place.
Quick Facts
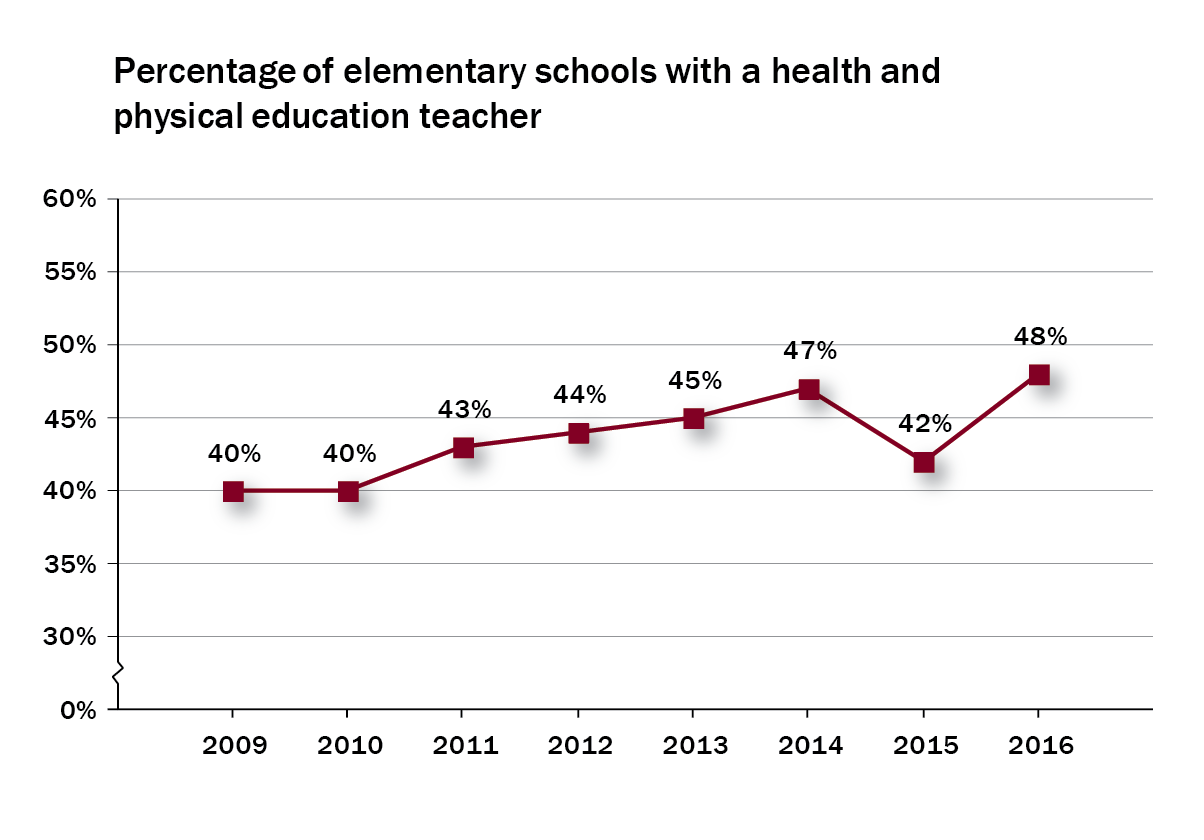
- 48% of elementary schools have a health and physical education teacher, compared to 40% in 2009.
- 61% of urban/suburban elementary schools have a health and physical education teacher, compared to 30% of small town/rural schools.
- 50% of elementary and 76% of secondary schools report having a regularly scheduled social worker.
Ontario’s revised Health and Physical Education curriculum is centred on the principle that “health and physical education programs are most effective when delivered in healthy schools and when students’ learning is supported by school staff, families, and communities.”3
The concept of a “healthy school” includes the social and physical environment, curriculum teaching and learning, healthy school policy, and student engagement; as well as home, school and community partnerships and services.4 Internationally and nationally, this concept is referred to as Comprehensive School Health.5 In addition to its impact on children’s health, the implementation of comprehensive models—such as Ontario’s Foundations for a Healthy School—has been connected to positive academic outcomes and ensuring that all students have the skills to excel academically and to lead happy, healthy lives.6
Healthy schools in Ontario
Ontario’s Ministry of Education has introduced a number of policies since 2005 to combat childhood obesity and improve students’ overall health. These strategies outline such things as the types of food and drinks that can be sold in schools, and the implementation of 20 minutes of mandatory daily physical activity.7 According to a report from the Auditor General, Ontario spent approximately $7.8 million on its Healthy Schools Strategy between 2009 and 2014.8
To achieve the changes in students’ health and well-being outlined in the new curriculum and the Healthy Schools Strategy, school health programs should be long-term, concentrated, and include both effective teaching strategies and supported connections between the school and community.9 The Ministry has acknowledged that these changes will not occur overnight, but in 2015, the Auditor General found little progress on the Healthy Schools Strategy initiatives.10 Most notably, the Auditor’s report found that the Ministry had failed to set up a monitoring system to ensure that school boards are complying with the recommendations in its policy: “…we found that the Ministry and school boards needed to put more effort into ensuring compliance with these requirements, and they needed to work more effectively with other organizations and stakeholders, including parents, to share effective practices for encouraging healthy living and increased physical activity throughout the system.”11
Health by numbers
Ontario’s goal is to ensure that each student works towards physical and emotional health, and that they do so in healthy school communities.12 To achieve this goal, teachers, principals, and parents are expected to work in partnership to create healthy school cummunities.13
The focus on health is evident in the upward trend in the percentage of Ontario elementary schools with a health and physical education teacher. This year, 48% of elementary schools report having a health and physical education teacher, either full- or part-time, compared to 40% in 2009 (see Figure 1). While the majority of health and physical education teachers have taken additional qualifications courses, not all are specialists.14
Figure 1
Unfortunately, because funding for specialist teachers is dependent on student numbers, schools and school boards are often forced to decide between different types of specialists. The increase in health and physical education teachers in elementary schools appears to be mirrored by a drop in specialists in the arts and libraries.15
Supporting students’ mental health
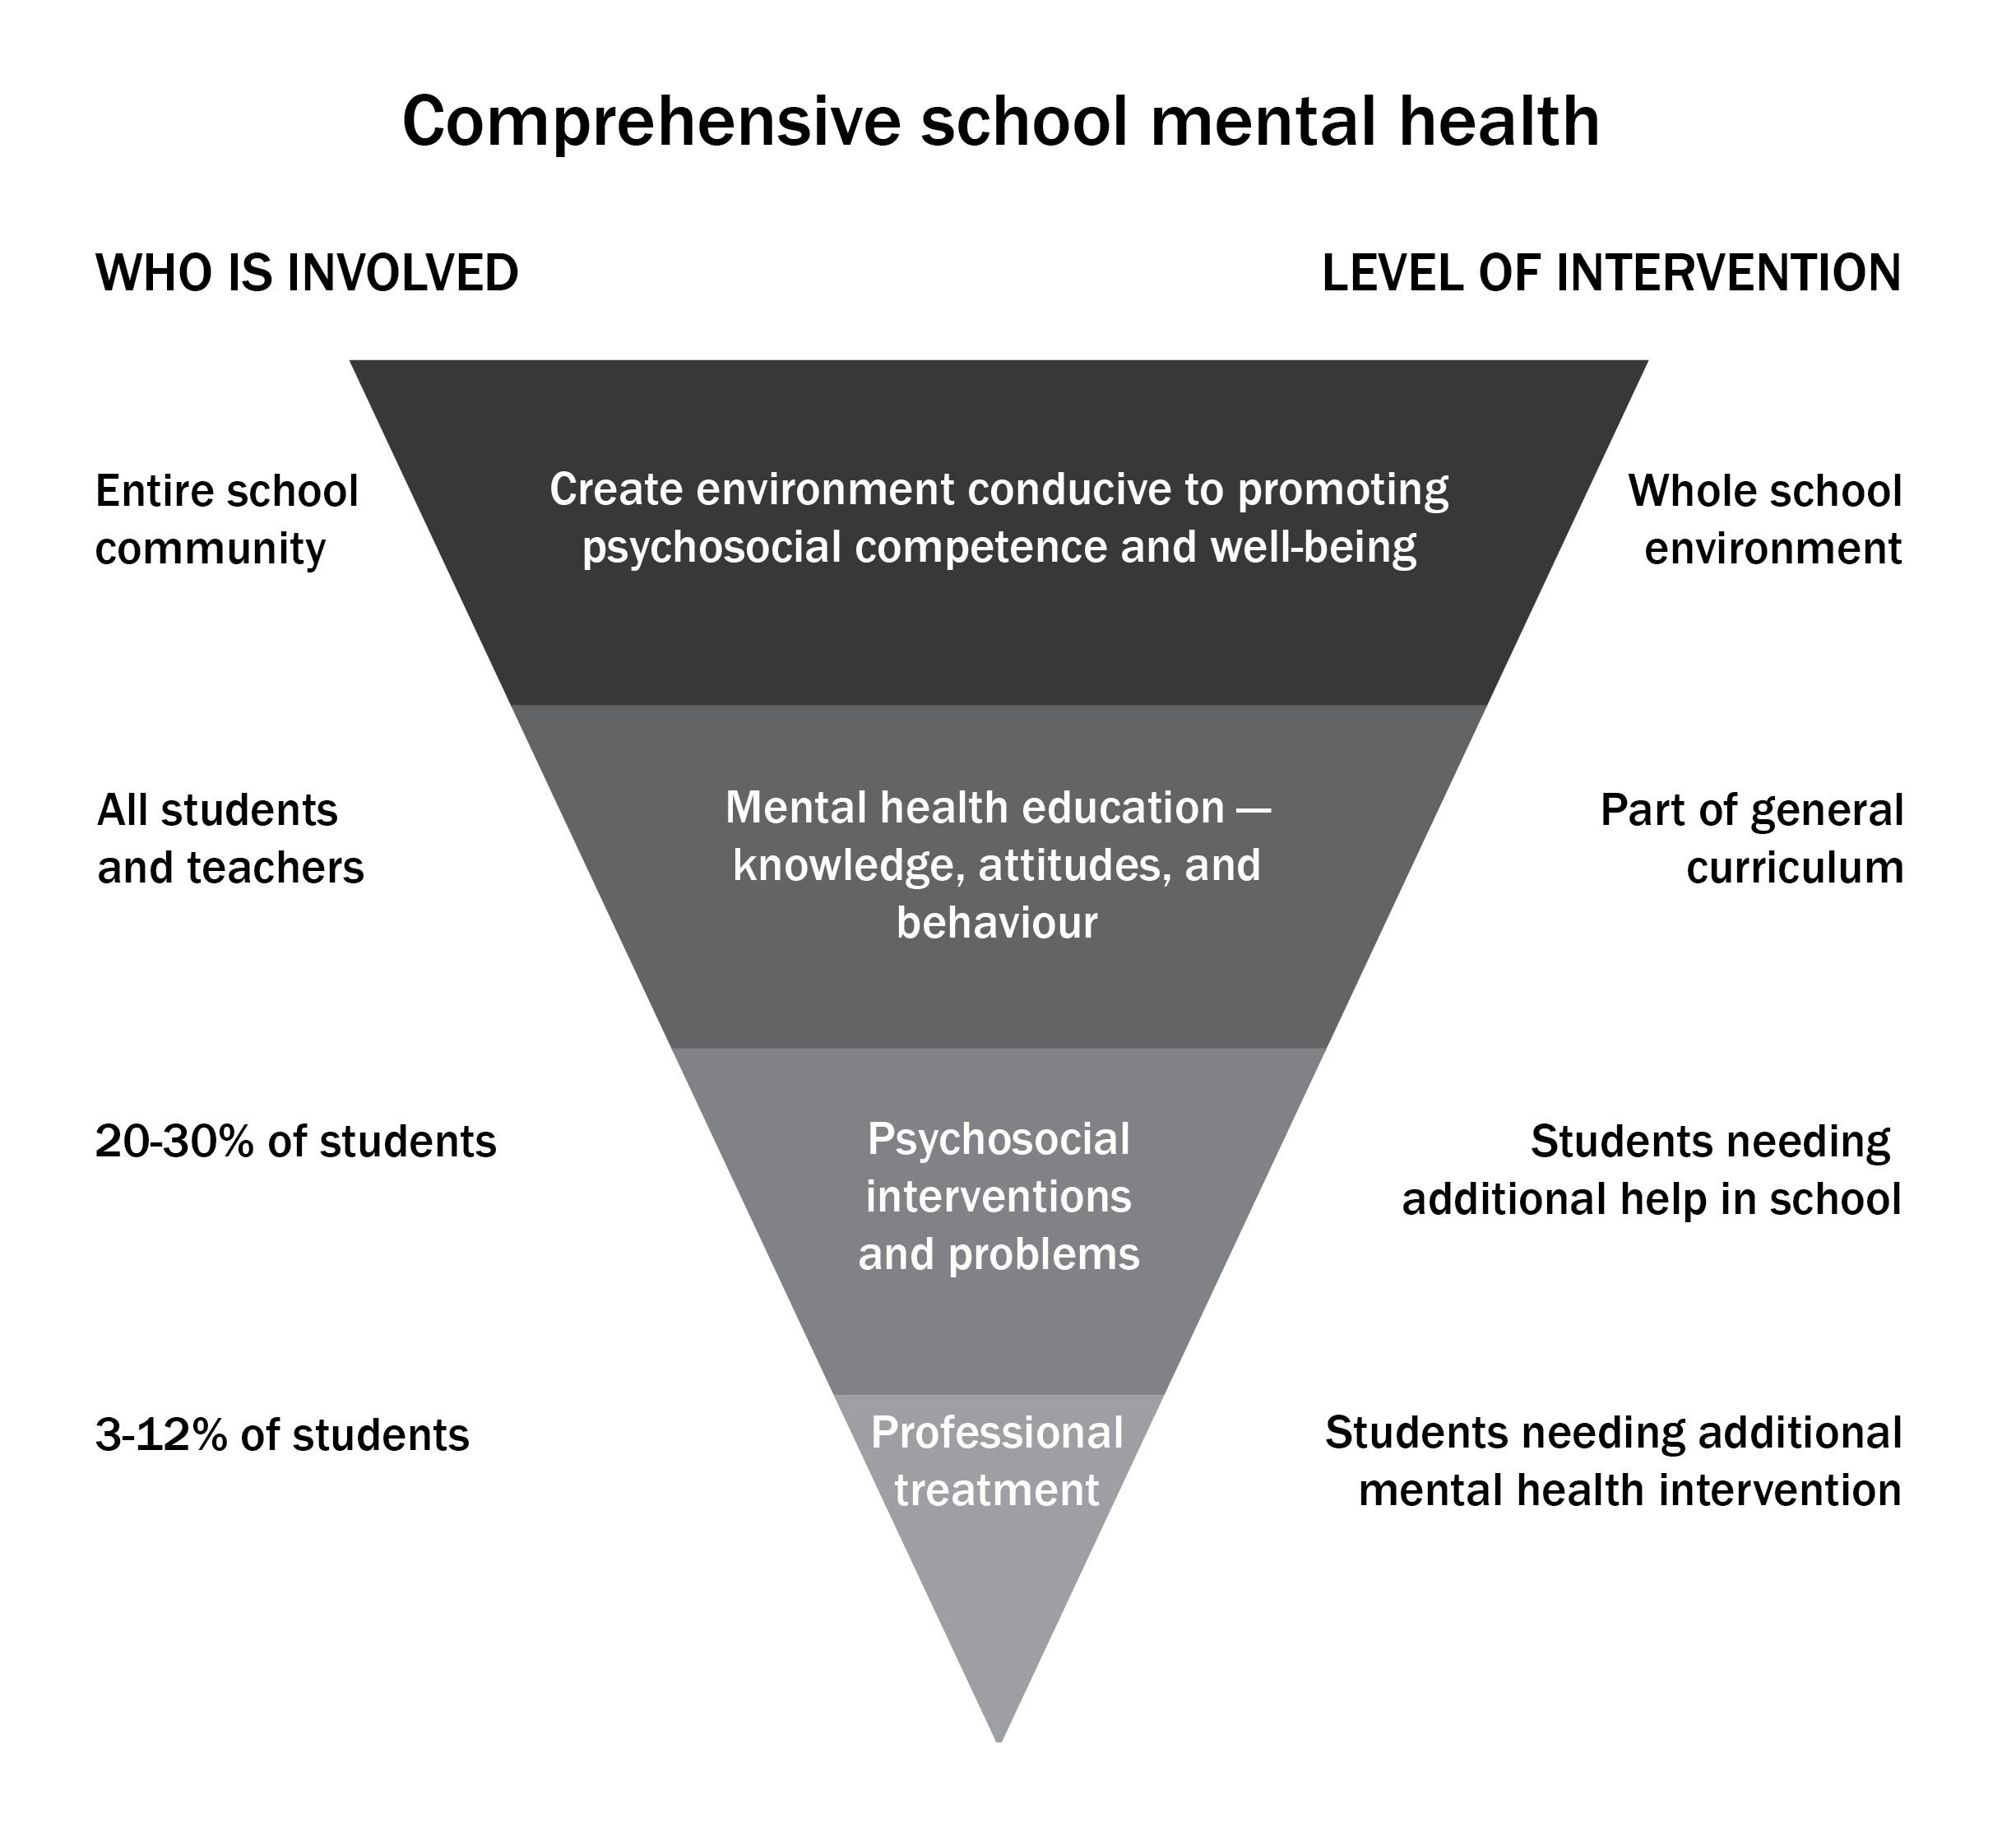
Along with physical health, mental health is a critical element of any comprehensive school health model. Figure 2 illustrates an example of a “whole school model” that is focused on mental health. The foundation lies in shaping the school’s environment into one that is “health promoting.”16
Given the ever-increasing mental health needs of our students, we need more access to services and more services available to schools.
Elementary school, Avon Maitland DSB
As Figure 2 shows, all schools have students who require additional support that may be difficult for regular teachers to provide. Boards often employ specialist staff, such as psychologists, social workers, or child and youth workers, to help these students overcome challenges relating to their mental health.17
Figure 218
In 2016:
- 50% of elementary and 76% of secondary schools report having a regularly scheduled social worker, compared to 43% of elementary and 63% of secondary schools in 2012.
- 37% of elementary and 53% of secondary schools report having a regularly scheduled child and youth worker, compared to 33% of elementary and 51% of secondary schools in 2012.
- 34% of elementary and 33% of secondary schools report having a regularly scheduled psychologist, compared to 35% of elementary and 36% of secondary schools in 2012.
Despite rising numbers in some areas, many principals still feel they are underserved, and that more mental health professionals are needed.
Psychologists, Social Workers and Speech Language Pathologists are shared amongst a number of schools. Although they have a scheduled half-day at the school, this isn’t enough to service the many students we have that end up on the growing wait list.
Elementary school, York Region DSB
Il y a de plus en plus d’enfant en besoin, mais les services ne grandissent pas.
Elementary school, CÉP de l’Est de l’Ontario19
Urban/suburban versus small town/rural
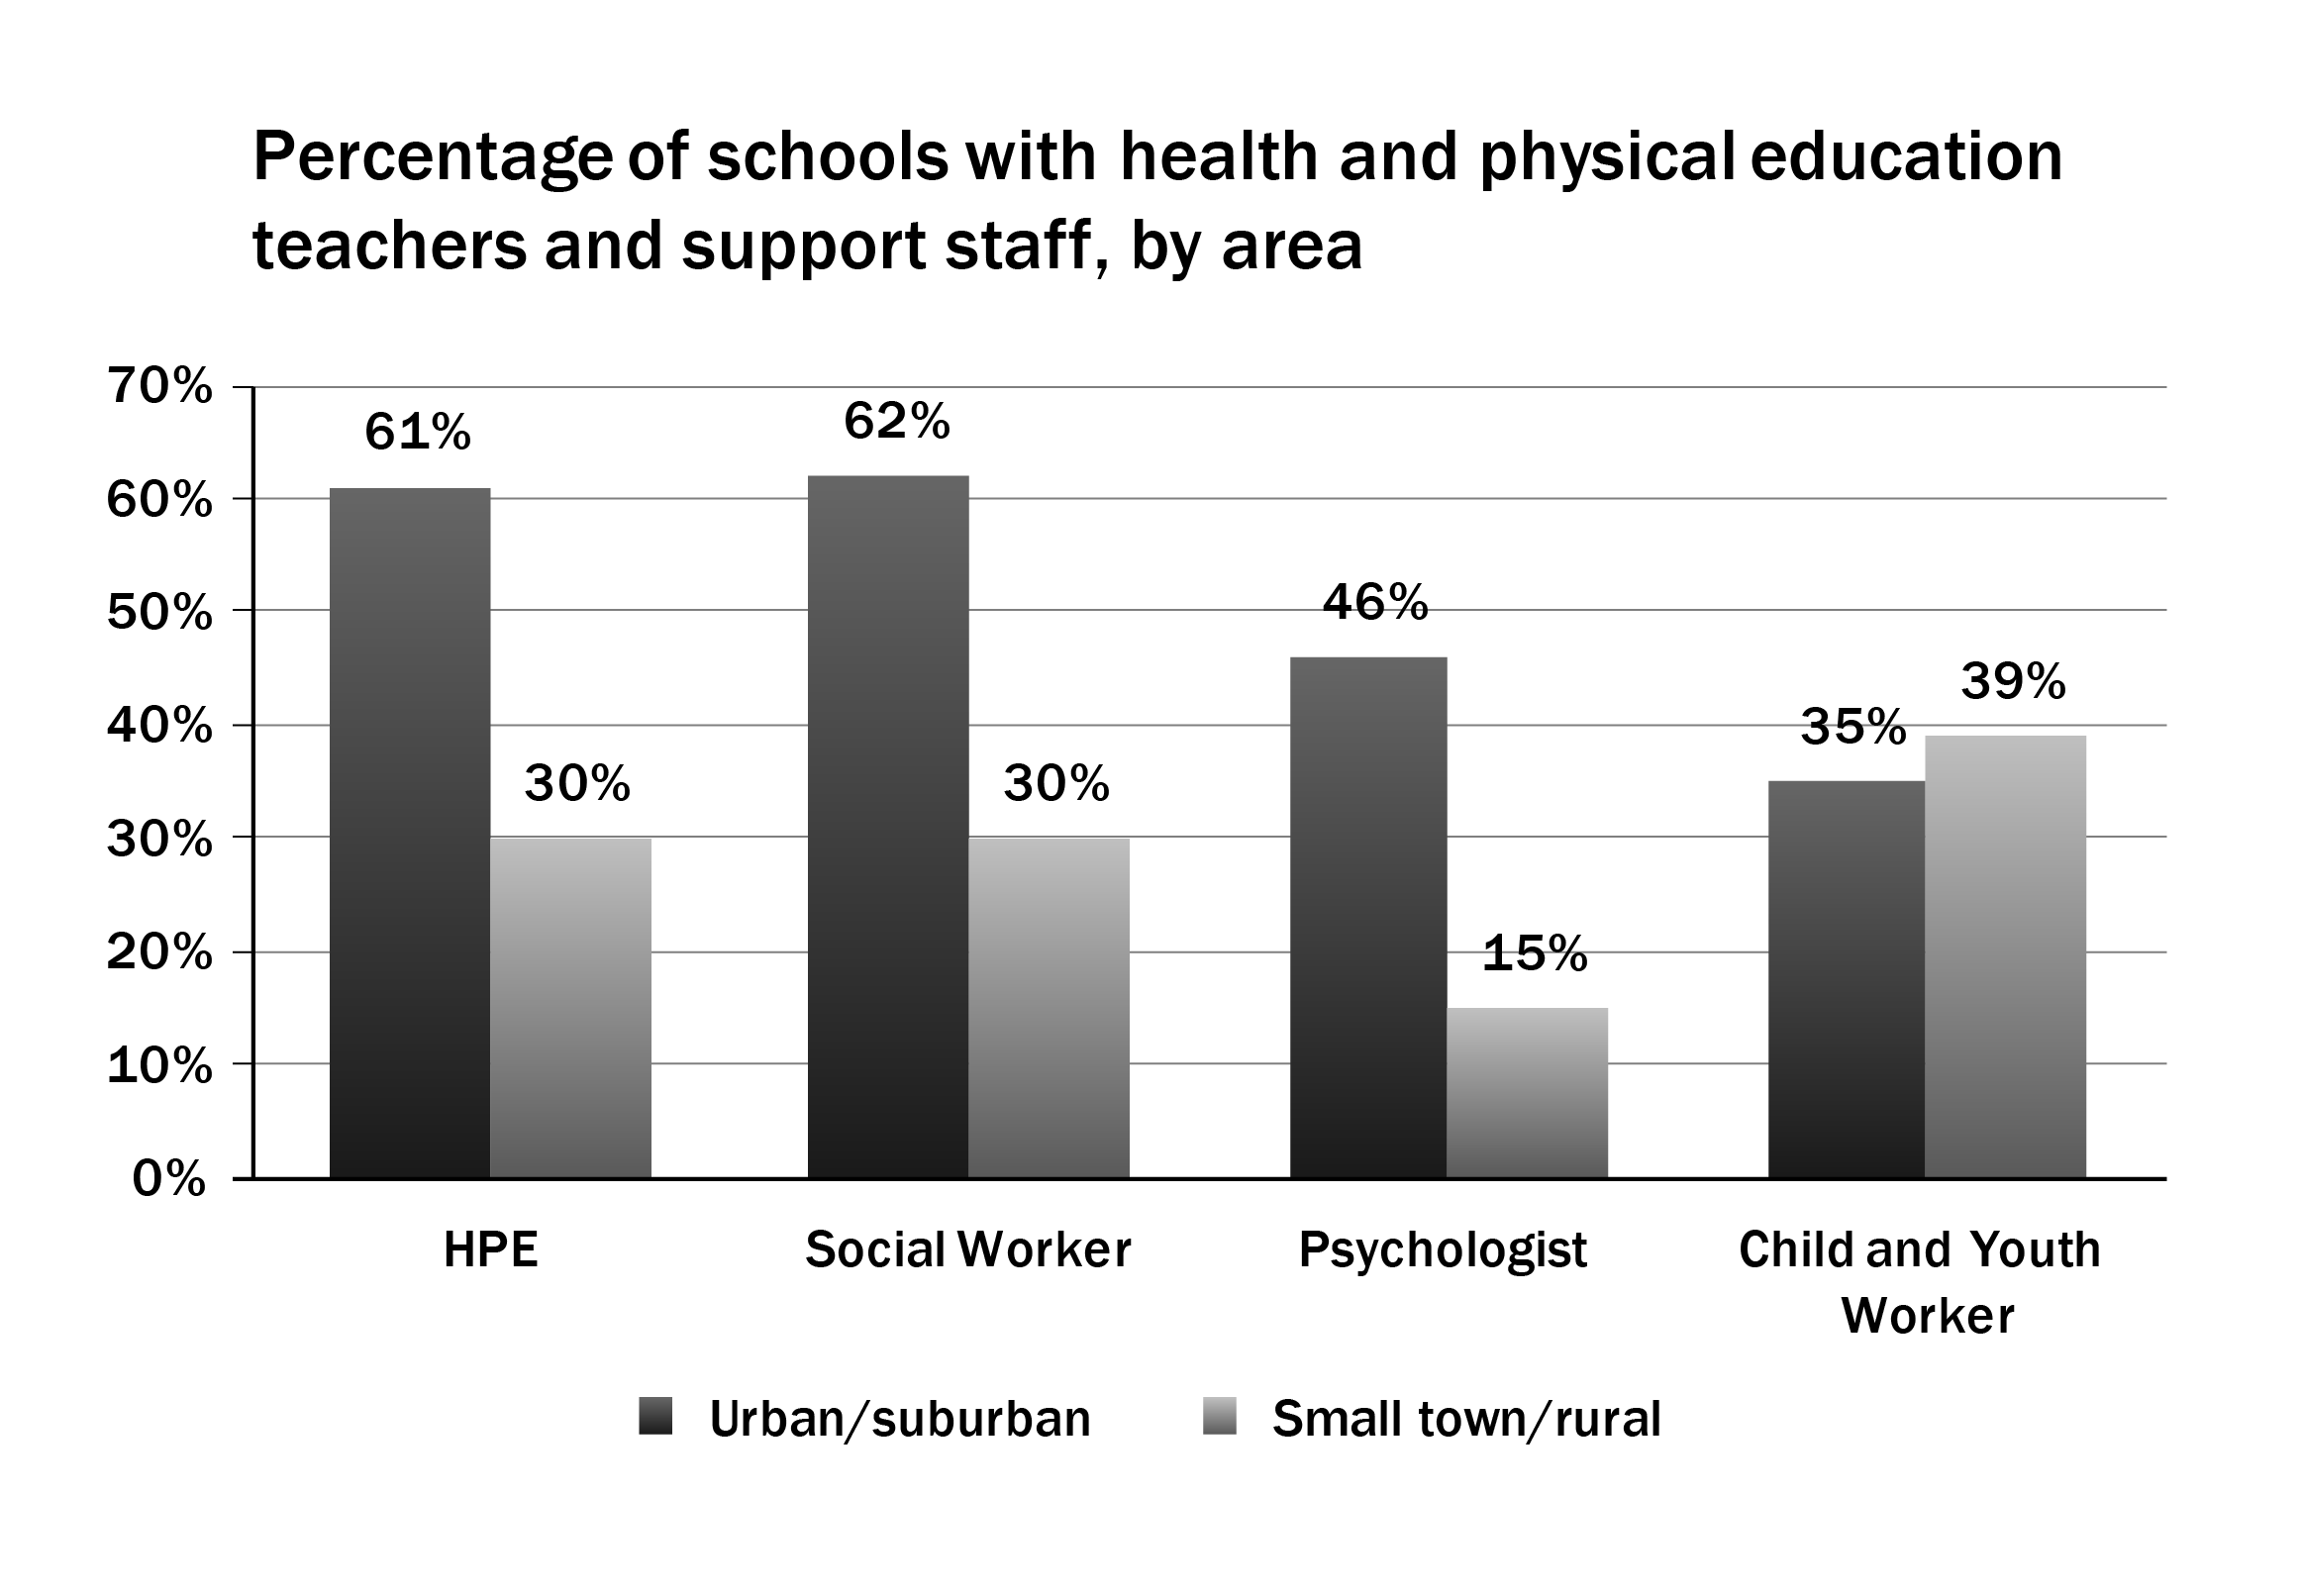
Although there are more health and physical education teachers and support staff available overall, boards in more remote areas are less likely to have access to them (see Figure 3):
- 61% of urban/suburban elementary schools have a health and physical education teacher, compared to 30% of small town/rural schools.
- 62% of urban/suburban elementary schools report regularly scheduled social workers, compared to 30% of small town/rural schools.
- 46% of urban/suburban elementary schools have a regularly scheduled psychologist, compared to 15% of small town/rural schools.
Only in child and youth workers do the proportions favour small town/rural schools. Thirty-five percent of urban/suburban schools report a regularly scheduled child and youth worker, compared to 39% in small town/rural schools.
Figure 3
Small town/rural boards, which typically have lower enrolment, may be at a disadvantage when it comes to hiring professionals and para-professionals such as psychologists, social workers and child and youth workers. As is the case with most education funding, boards receive funds for these staff based on enrolment. The province provides funding at a rate of one staff member with a salary of approximately $58,000 (not including benefits) for every 578 students.20 It is up to individual boards to decide which staff to hire. Average salaries in these professions range from approximately $39,000 per year for child and youth workers, to $61,000 for social workers, and approximately $70,000 for psychologists.21 Boards with lower enrolments may be making decisions about which types of support staff to employ based on finances rather than need.
In the past, we have formulated the timetable to allow for a specialist health and physical education teacher to deliver programming to the majority of the classes. Unfortunately, the only way to accomplish this is by assigning the prep coverage to the health and physical education teacher. This would result in a reduction in teacher–librarian time in the library, as part of their allocation is prep coverage.
Elementary school, Kawartha Pine Ridge DSB
Quick Facts
- 43% of elementary schools have a music teacher, either full- or part-time.
- 33% of urban/suburban elementary schools have a full-time music teacher, compared to 11% in small town/rural schools.
Arts education plays a vital role in student engagement, achievement, and well-being.22 Learning about and participating in the arts helps students to develop a range of competencies and skills—not just in creativity, but also in citizenship, social-emotional learning, and health.23 These broad skills are key to fostering success in today’s society. Given that 95% of Ontario’s children attend public schools,24 the publicly funded school system is the ideal environment for them to receive formal education in the arts.
Specialized curriculum may require specialized teachers
Ontario’s arts curriculum promotes the development of knowledge and skills in dance, drama, music, and visual arts through four core learning objectives: developing creativity, communicating, understanding culture, and making connections.25 Each area of the arts curriculum requires specialized knowledge. For example, in the elementary music curriculum, students are expected to learn to read and understand music by creating, interpreting, and performing it.26 Dance, fine arts, and drama also have extensive technical expectations over the eight years of elementary curriculum.27 In order to fulfill these expectations, teachers need a fairly high degree of technical understanding, which may be a challenge for a classroom teacher without a background in the arts.28
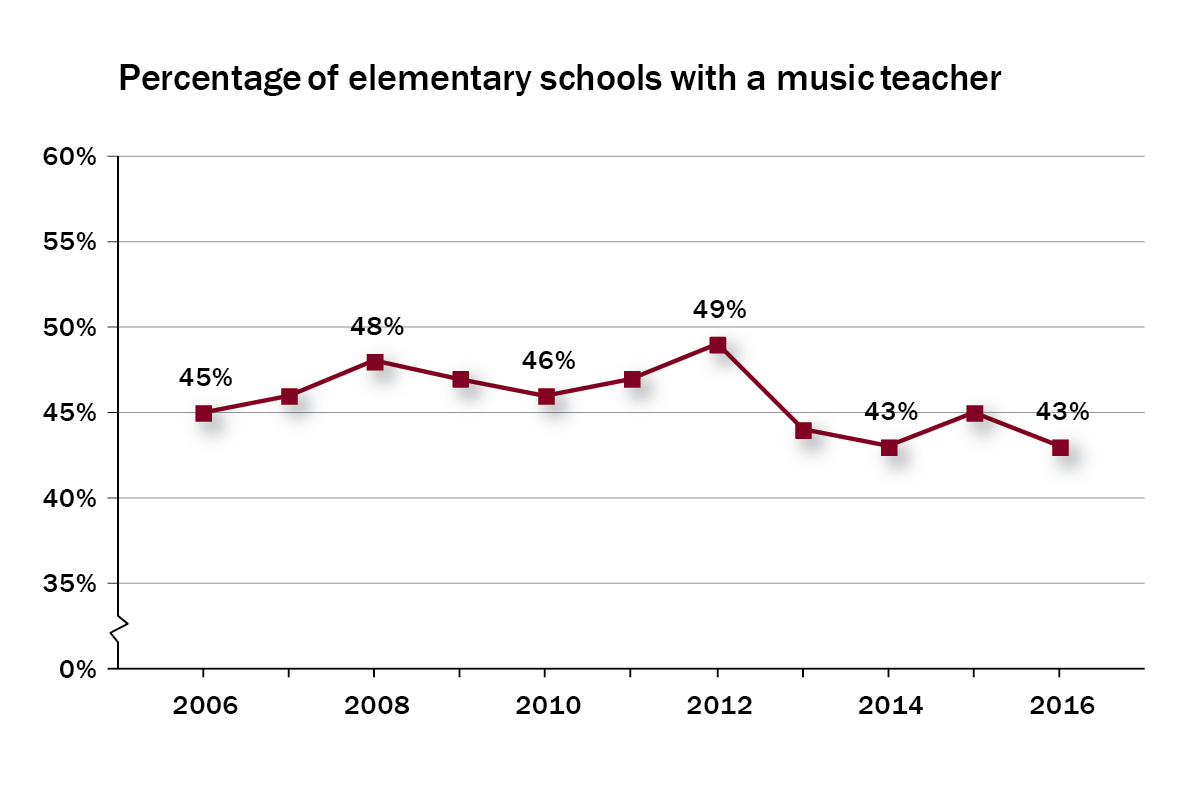
Figure 4
Specialist arts teachers
The province’s renewed vision for education includes a commitment to, “promote the value of the arts, including the visual and performing arts, in developing critical and creative thinking skills that support success in school and in life.”29 Despite this commitment, there continues to be a lack of specialist teachers in music, visual arts, and drama in elementary schools.
In 2016:
- 43% of elementary schools have a music teacher, either full- or part-time, compared to 45% last year. This is the lowest percentage in 10 years (see Figure 4) and is dramatically lower than in 1998, when 58% of elementary schools had specialist music teachers.
- 38% of elementary schools report having an itinerant music teacher, compared to 39% last year.
- 15% of elementary schools with grades 7 and 8 have specialist visual arts teachers, remaining consistent with last year.
- 9% of elementary schools with grades 7 and 8 have a specialist drama teacher, unchanged in the last two years.
In their comments, a number of principals identify staffing and resource constraints as reasons for the decline in arts specialists.
We have an excellent music programme that provides specialist instruction in grades 4 through 6, and instrumental music classes to students in grades 7 and 8. Extending the specialist instruction to all grades is a goal, but a significant challenge based upon the way in which FTE is allocated.
Elementary school, Kawartha Pine Ridge DSB
Equity and access to arts-enriched learning
Data from this year’s survey show that in elementary schools, geography has an impact on access to specialist arts teachers (see Figure 5). Elementary schools that report having a specialist music teacher also report greater opportunities to participate in other arts activities.
Figure 5
More than 80% of elementary and secondary schools report opportunities for students to participate in a performance/exhibition, learn an instrument within school hours, or work with an artist or other professional from outside of the school. These opportunities have been shown to enrich students’ experience of the arts and promote student engagement;30 but for elementary schools in particular, it appears that whether students have these opportunities is influenced by whether they have a specialist music teacher (see Table 1).
We have a huge instrumental music program because of a staff member who has a degree in music.
Elementary school, Upper Canada DSB
Table 1
Arts enrichment in elementary schools |
||
| Schools with a music teacher (full- or part-time) | Schools with NO music teacher | |
| Work with an artist or other professional from outside of the school | 78% | 73% |
| Learn an instrument within school hours | 92% | 72% |
| Participate in a performance/exhibition (e.g., play, dance, art exhibition) | 95% | 89% |
Quick Facts
- Only 54% of elementary schools have teacher–librarians, and only 10% have a full-time teacher–librarian.
- Only 55% of secondary schools report a full-time teacher–librarian.
- 60% of elementary schools in urban/suburban communities report having a teacher–librarian, compared to 44% of small town/rural schools.
School libraries play an essential role in ensuring that Ontario’s students are prepared for today’s information- and knowledge-based society. School library programs can provide opportunities for students to develop a love of reading, an understanding of diverse texts, problem solving, digital literacy, and citizenship skills.31 School libraries also help students access curriculum-support resources, and they teach students to value the role of libraries in school and society.32
In Ontario, many school libraries have recently transitioned to a Learning Commons model, where the library provides both a physical and virtual space for student learning.33 This model requires collaboration between teacher–librarians, classroom teachers, students, principals, and technical staff. It also integrates technology into a space that is dynamic and adaptable based on students’ learning needs.34
Decline in teacher–librarians
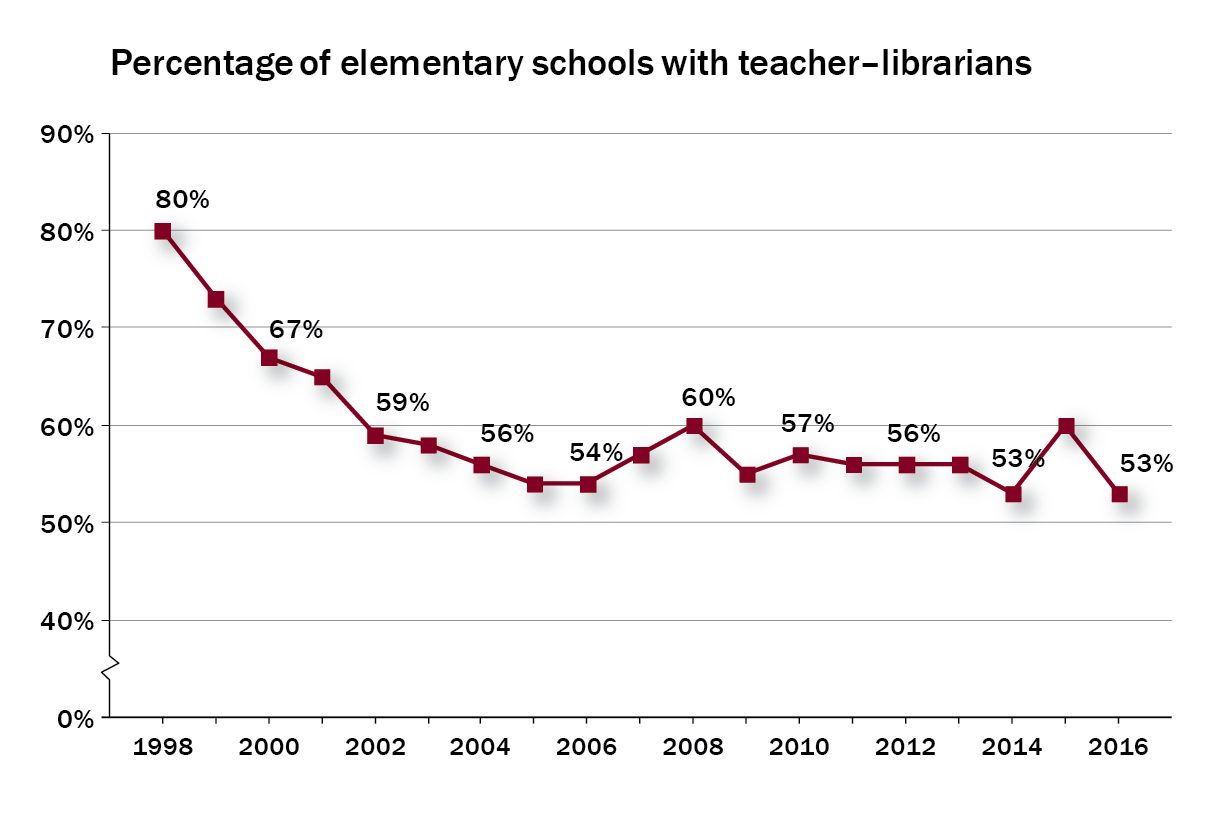
Teacher–librarians, in collaboration with classroom teachers, can help to foster important skills for student success, including information literacy, problem solving, communication, and critical thinking.35 Over the past 15 years, there has been a decline in teacher–librarians in Ontario’s publicly funded schools (see Figure 6).
Figure 6
In 2016:
- In elementary schools, only 54% of schools have teacher–librarians, a decline from 60% last year and 80% in 1998.
- The majority of elementary teacher–librarians are part-time, with only 10% of schools having at least one full-time teacher–librarian.
- The percentage of secondary schools with a full- or part-time teacher–librarian has increased marginally from last year—from 72% to 74%—however, there has been a slight decline in secondary schools reporting full-time teacher–librarians.
Funding constraints have forced a number of boards to cut teacher–librarian positions. For example, in 2015, the Toronto Catholic DSB cut teacher–librarian positions in all of its elementary schools to manage the board’s $42.6 million budget shortfall.36 Since 2011, the Windsor-Essex Catholic DSB has also made significant cuts to school library services and resources, including the elimination of school library staff.37 Cuts of this magnitude may undermine students’ opportunities to develop the broad skills that are supported through an effective school library program.38
The rise of library technicians
While the percentage of elementary schools with teacher–librarians has declined, there has been an increase in schools with library technicians. This could be a direct result of a difference in pay scales. School boards receive funding from the province for one elementary library staff for every 763 students at a rate of $74,000 (before benefits).39 The average wage for a library technician is between $32,000 and $61,000.40 Boards can save considerable funding by staffing their libraries with library technicians instead of teacher–librarians.
While library technicians have an important role in school libraries, it differs from that of teacher–librarians. In Canada, library technicians play a supportive role, operating between a “clerk and a librarian,”41 unlike teacher–librarians, who are Ontario certified teachers with specialist qualifications in librarianship.42
In 2016:
- 49% of elementary schools have a library technician, compared to 43% last year.
- 49% of secondary schools have a library technician, compared to 44% last year.
According to the Ontario Library Association, the decline in the percentage of schools with teacher–librarians and the increased reliance on library technicians is having an impact on the quality of school library programs, and on their capacity to achieve goals of reading engagement, information literacy, and co-teaching and co-planning.43
Urban/suburban versus small town/rural
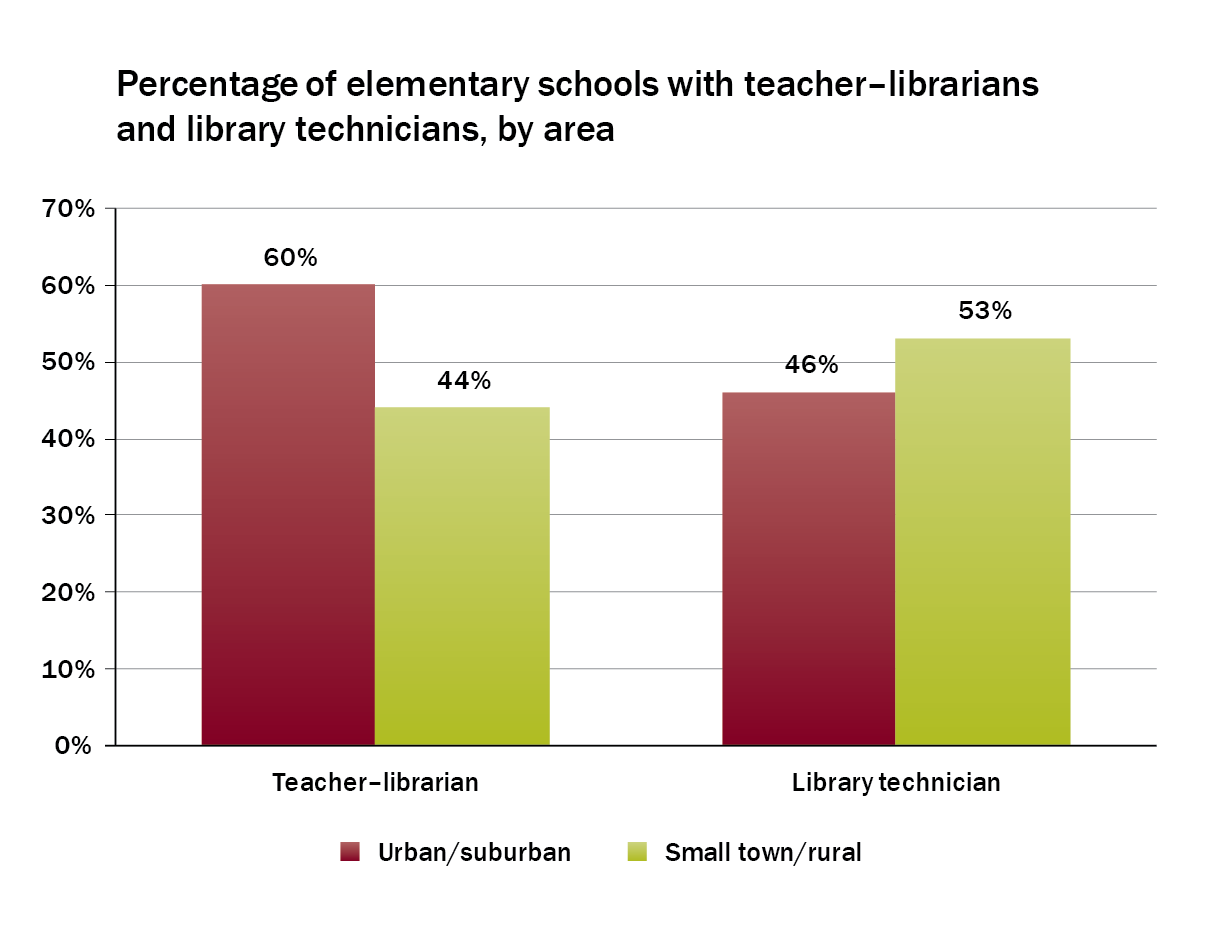
There are wide discrepancies between school library staff in urban/suburban and small town/rural schools. The lack of staff in small town/rural elementary school libraries may limit students’ opportunities to develop the broad skill set that school libraries may foster.
In 2016 (see Figure 7):
- 44% of elementary schools in small town/rural areas report having a teacher–librarian, compared to 60% of urban/suburban schools.
- 53% of elementary schools in small town/rural areas report having a library technician, compared to 46% of urban/suburban schools.
Figure 7
In the past, we have formulated the timetable to allow for a specialist health and physical education teacher to deliver programming to the majority of the classes. Unfortunately, the only way to accomplish this is by assigning the prep coverage to the health and physical education teacher. This would result in a reduction in teacher–librarian time in the library, as part of their allocation is prep coverage.
Elementary school, Kawartha Pine Ridge DSB
Quick Facts
- 99% of all secondary schools report having a guidance counsellor.
- Only 25% of elementary schools with grades 7 and 8 have a guidance counsellor, either full- or part-time.
- 94% of urban/suburban secondary schools have a full-time guidance counsellor, compared to 74% of small town/rural schools.
Expectations for guidance counsellors have been rising in recent years.44 In new provincial policies that outline comprehensive school supports for social-emotional development, health and well-being, and career and life planning, the Ministry of Education has routinely envisioned guidance counsellors performing a wider range of tasks. Funding for guidance counsellors, however, has remained relatively unchanged since Ontario’s education funding formula was introduced in 1998.45
In this year’s survey, schools report two major challenges related to rising expectations for guidance counsellors:
- Guidance counsellors are pulled in many directions, and the role of a guidance counsellor has become unclear.
- Guidance counsellors are few in number.
- Secondary schools report an average of 381 students for every guidance counsellor. In some secondary schools, this ratio climbs as high as 595 students.
- Only 25% of elementary schools with grades 7 and 8 have a guidance counsellor, either full- or part-time.
Rising expectations for guidance counsellors
Since 2012, the Ministry has introduced many policies that place guidance counsellors in key supporting roles. Creating Pathways to Success calls for well-coordinated career and life planning from kindergarten to grade 12, and identifies guidance counsellors as having a “strategic role” in helping students make effective transitions throughout school.46 In describing mental health strategies, Supporting Minds instructs teachers to connect students struggling with mental health issues to guidance counsellors.47 Other provincial initiatives call on guidance counsellors to provide individual counselling services, serve on collaborative school teams, and support social-emotional development programming.48
The unclear role of guidance counsellor
The province currently has no specific job description for guidance counsellors in schools, using only a broad description from Canada’s National Occupation Classification that does not distinguish between the roles of elementary and secondary school counsellors.49
The diverse range of expectations for guidance counsellors is reflected in this year’s survey. More than 80% of schools report that guidance counsellors play a primary role in each of the following activities:
- supporting student transition planning;
- collaborating with school teams or departments;
- supporting academic achievement;
- supporting student mental health; and
- supporting the development and refinement of students’ Individual Pathway Plans.
The role of the guidance teacher is not well-defined in the policy document Creating Pathways to Success. With the emergence of non-teacher support services in the school, the role of the guidance teacher could use clarification.
Secondary school, Lambton Kent DSB
Guidance counsellors are expected to deliver supports in numerous areas that require both complex skills and substantial time with individual students.50 Although there may be perceived advantages to having guidance counsellors work in so many different areas, schools indicate a disconnect between policy expectations and the reality on the ground, reporting that guidance counsellors are “spread thinly” and “pulled in too many directions.”
Given rising demands, schools report a lack of clarity on the guidance counsellor’s role. In this year’s survey, schools ranked seven activities based on the amount of time a guidance counsellor spends on them (see Figure 8). Secondary schools rank supporting academic achievement (38%) and supporting mental health (25%) as activities consuming the most time. However, there is little consensus among schools: nearly 40% of schools rank one of the other five activities as consuming the most time.
Figure 8
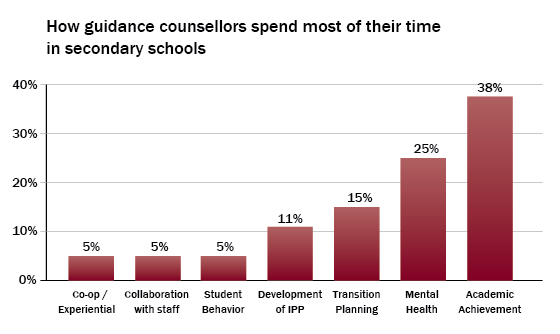
Note: An IPP (Individual Pathway Plan) is a planning tool that students use to record both what they have learned and their future goals. Provincial policy mandates that all students must have an IPP by Grade 7 (Creating Pathways).51
All students with Individual Education Plans are required to have Transition Plans to support transitions, including into school, between grades, programs and schools, from elementary to secondary and from secondary school to the “next appropriate pathway.”52
The guidance activity consuming the most time also varied among elementary schools. In the limited number of elementary schools with guidance counsellors, 40% rank transition planning as taking up the highest proportion of counsellors’ time, while 22% report mental health as number one.
Disparate access to guidance counsellors
Although 99% of secondary schools report having a guidance counsellor, access differs widely across schools. The average ratio is 381 students per guidance counsellor. However, this ratio jumps to 595 students per guidance counsellor in 10% of secondary schools.
In elementary schools with grades 7 and 8, students must choose courses for secondary school that can greatly influence their post-secondary options and future careers.53 Students also undergo many emotional, social, and physical changes during this time. Research indicates that Ontario’s school counsellors may have an especially vital support role for students in grades 7 and 8.54 Despite this, only 25% of schools with grades 7 and 8 have a guidance counsellor, full- or part-time.
The challenge is that the guidance teacher has been assigned to 14 schools. Therefore, she is here only one afternoon every two weeks—not enough to see the students who can benefit from her service.
Elementary school with grades 7 and 8, Toronto DSB
Geography and school size affect access to guidance counsellors. Seventy-four percent of small town/rural secondary schools have full-time guidance counsellors, compared to 94% of urban/suburban schools. Only 10% of small town/rural elementary schools with grades 7 and 8 have either a full- or part-time guidance counsellor. By contrast, 38% of urban/suburban elementary schools with grades 7 and 8 have either full- or part-time counsellors. These differences are largely a result of Ontario’s per-pupil funding formula, which supports more staff in school boards with higher student populations.
Figure 9
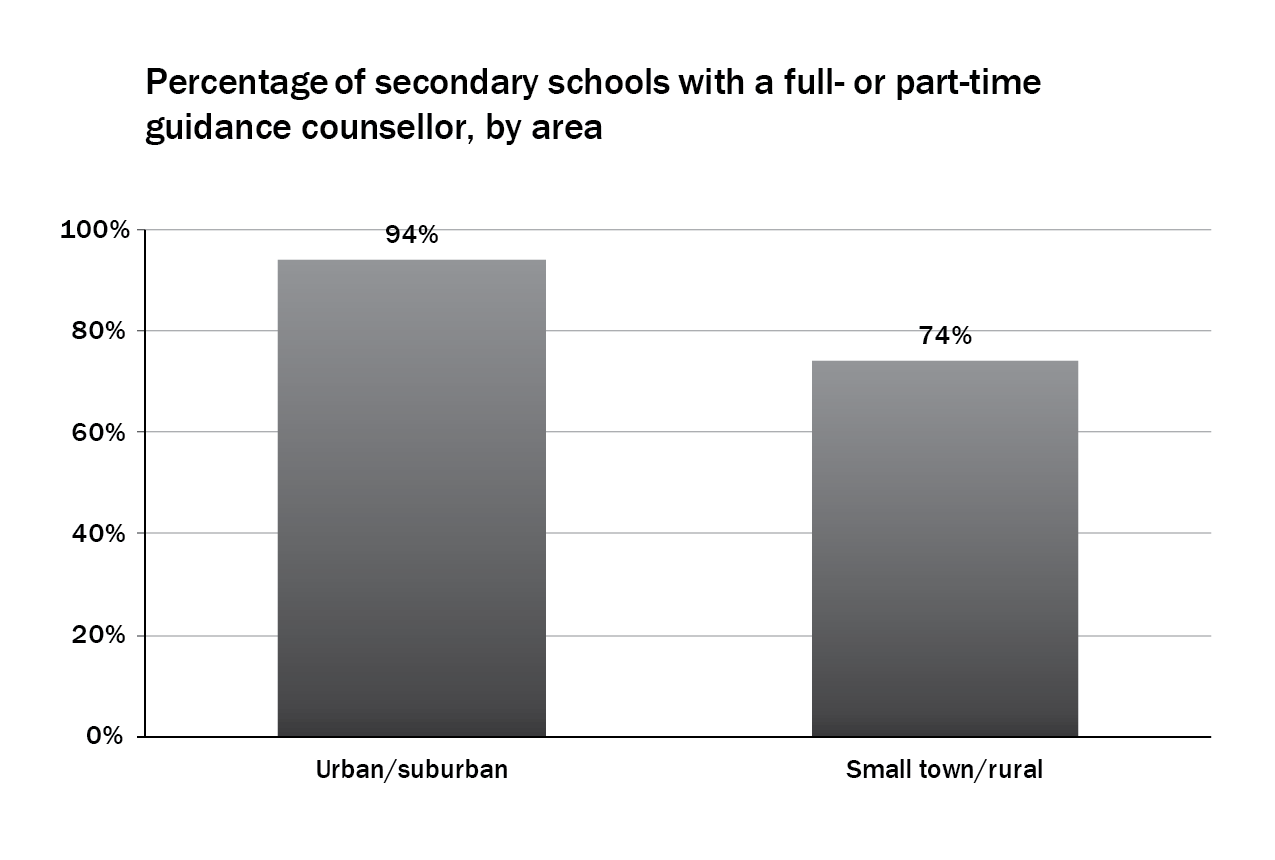
Figure 10
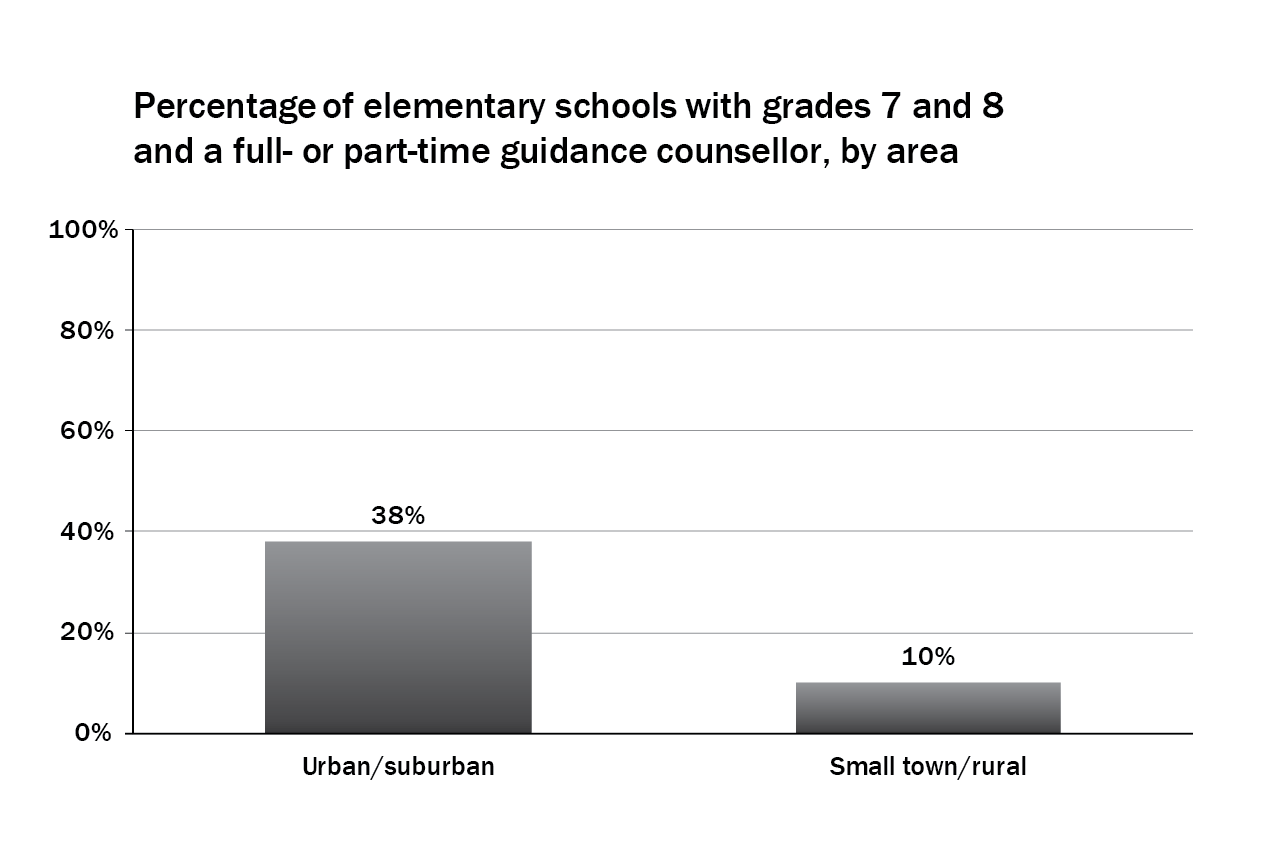
Counsellors offer depth and breadth of expertise in order to support diverse student learners. Guidance staff work in collaboration with administration, student success, student services (special education), alternative education, cooperative education and [English language learners]… Time constraints pull guidance staff in too many directions.
Secondary school, York Region DSB
Quick Facts
- An average of 17% of students in each elementary school, and 27% of students in each secondary school receive any assistance from the special education department.
- 59% of elementary and 52% of secondary schools report that there are restrictions on the number of students they can place on waiting lists for assessments.
- 91% of urban/suburban elementary schools report having a full-time special education teacher, compared to only 66% of small town/rural schools.
All students, regardless of ability or specialized instructional needs, have equal rights to public education in Ontario. This principle is embedded in our current education system, and, for students identified with special education needs, enshrined in law.55 Virtually every school in Ontario has students who receive special education assistance.56
Access to resources and support
In 2016, an average of 17% of students in each elementary school and 27% of students in each secondary school receive any assistance from the special education department. Supports for students cover a wide range—from specialized classes and equipment for students with very high needs, to a little extra help during the day in a regular classroom. Not all students with special education needs require or receive support from qualified special education teachers. In cases where students are receiving support in a regular classroom, for example, the classroom teacher may be supported by a special education teacher who works with all of the teachers in the school. In other cases—where students may have higher, or particular needs—the students may be withdrawn for all or part of the day to a special education class. While the ratio of students receiving special education support to special education teachers has remained fairly steady in elementary schools over the last four years, there has been a substantial increase in the ratio in secondary schools (see Figure 11).
Figure 11
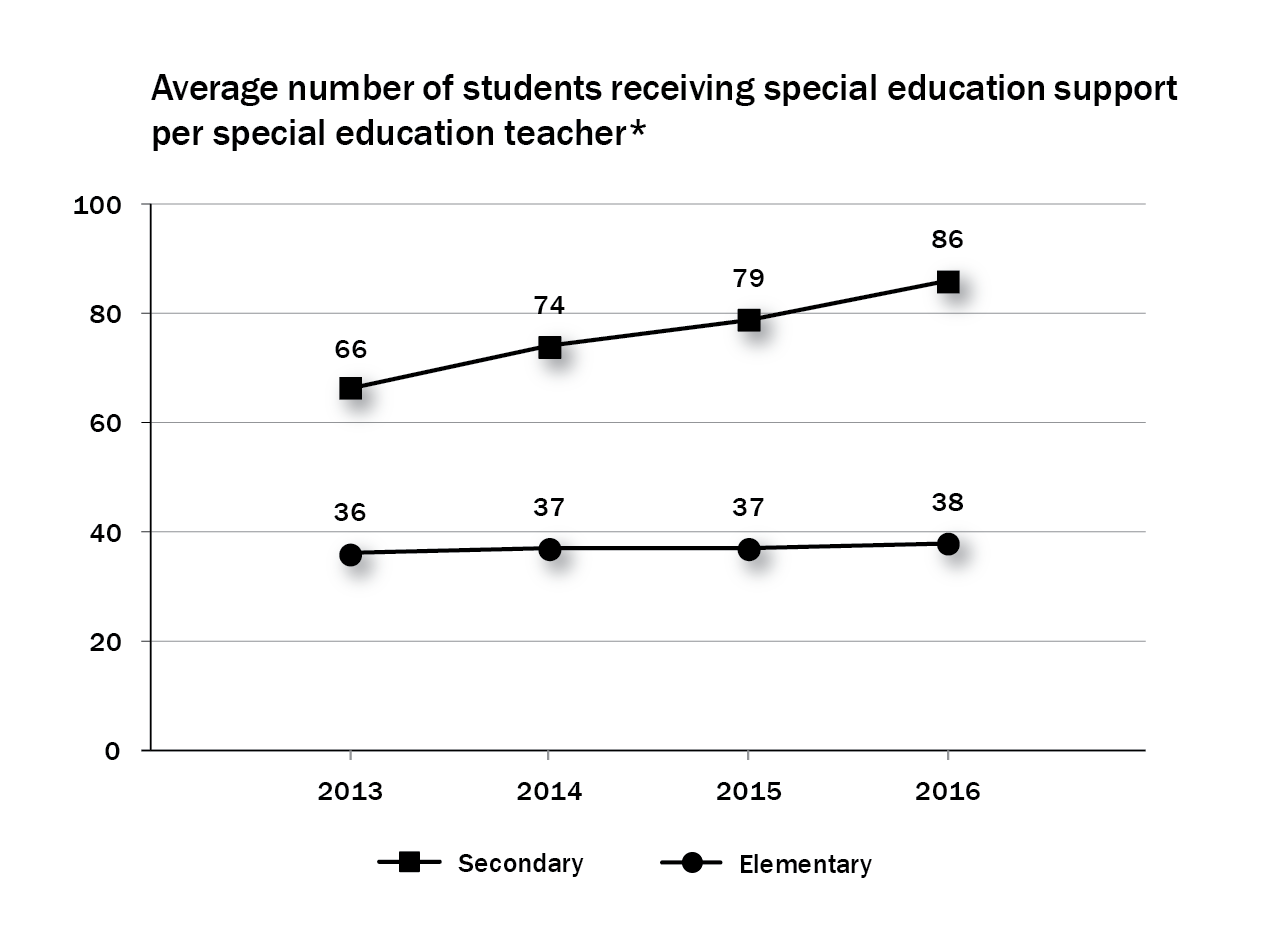
*This is an average per school.
Lots of successes due to our GREAT team of teachers, [resource teachers] and [educational assistants]. We work together with parents and students to serve needs. We make excellent use of the support we receive and we know how very valuable it is!
Elementary school, Huron Perth CDSB
Providing support for students—Waiting lists and restrictions
While 44% of students receiving special education support have Individual Education Plans only (and no formal identification), 56% go through an Identification Placement and Review (IPRC) process.57 This process is required in order to be identified under one of the province’s categories of exceptionality.58 Once a student is identified, the IPRC makes a recommendation on the type of supports and/or placements to be provided.
[Services are] hard to access since we are 2.5 hours away from our Board Office and support staff.
Elementary school, Rainbow DSB
Figure 12
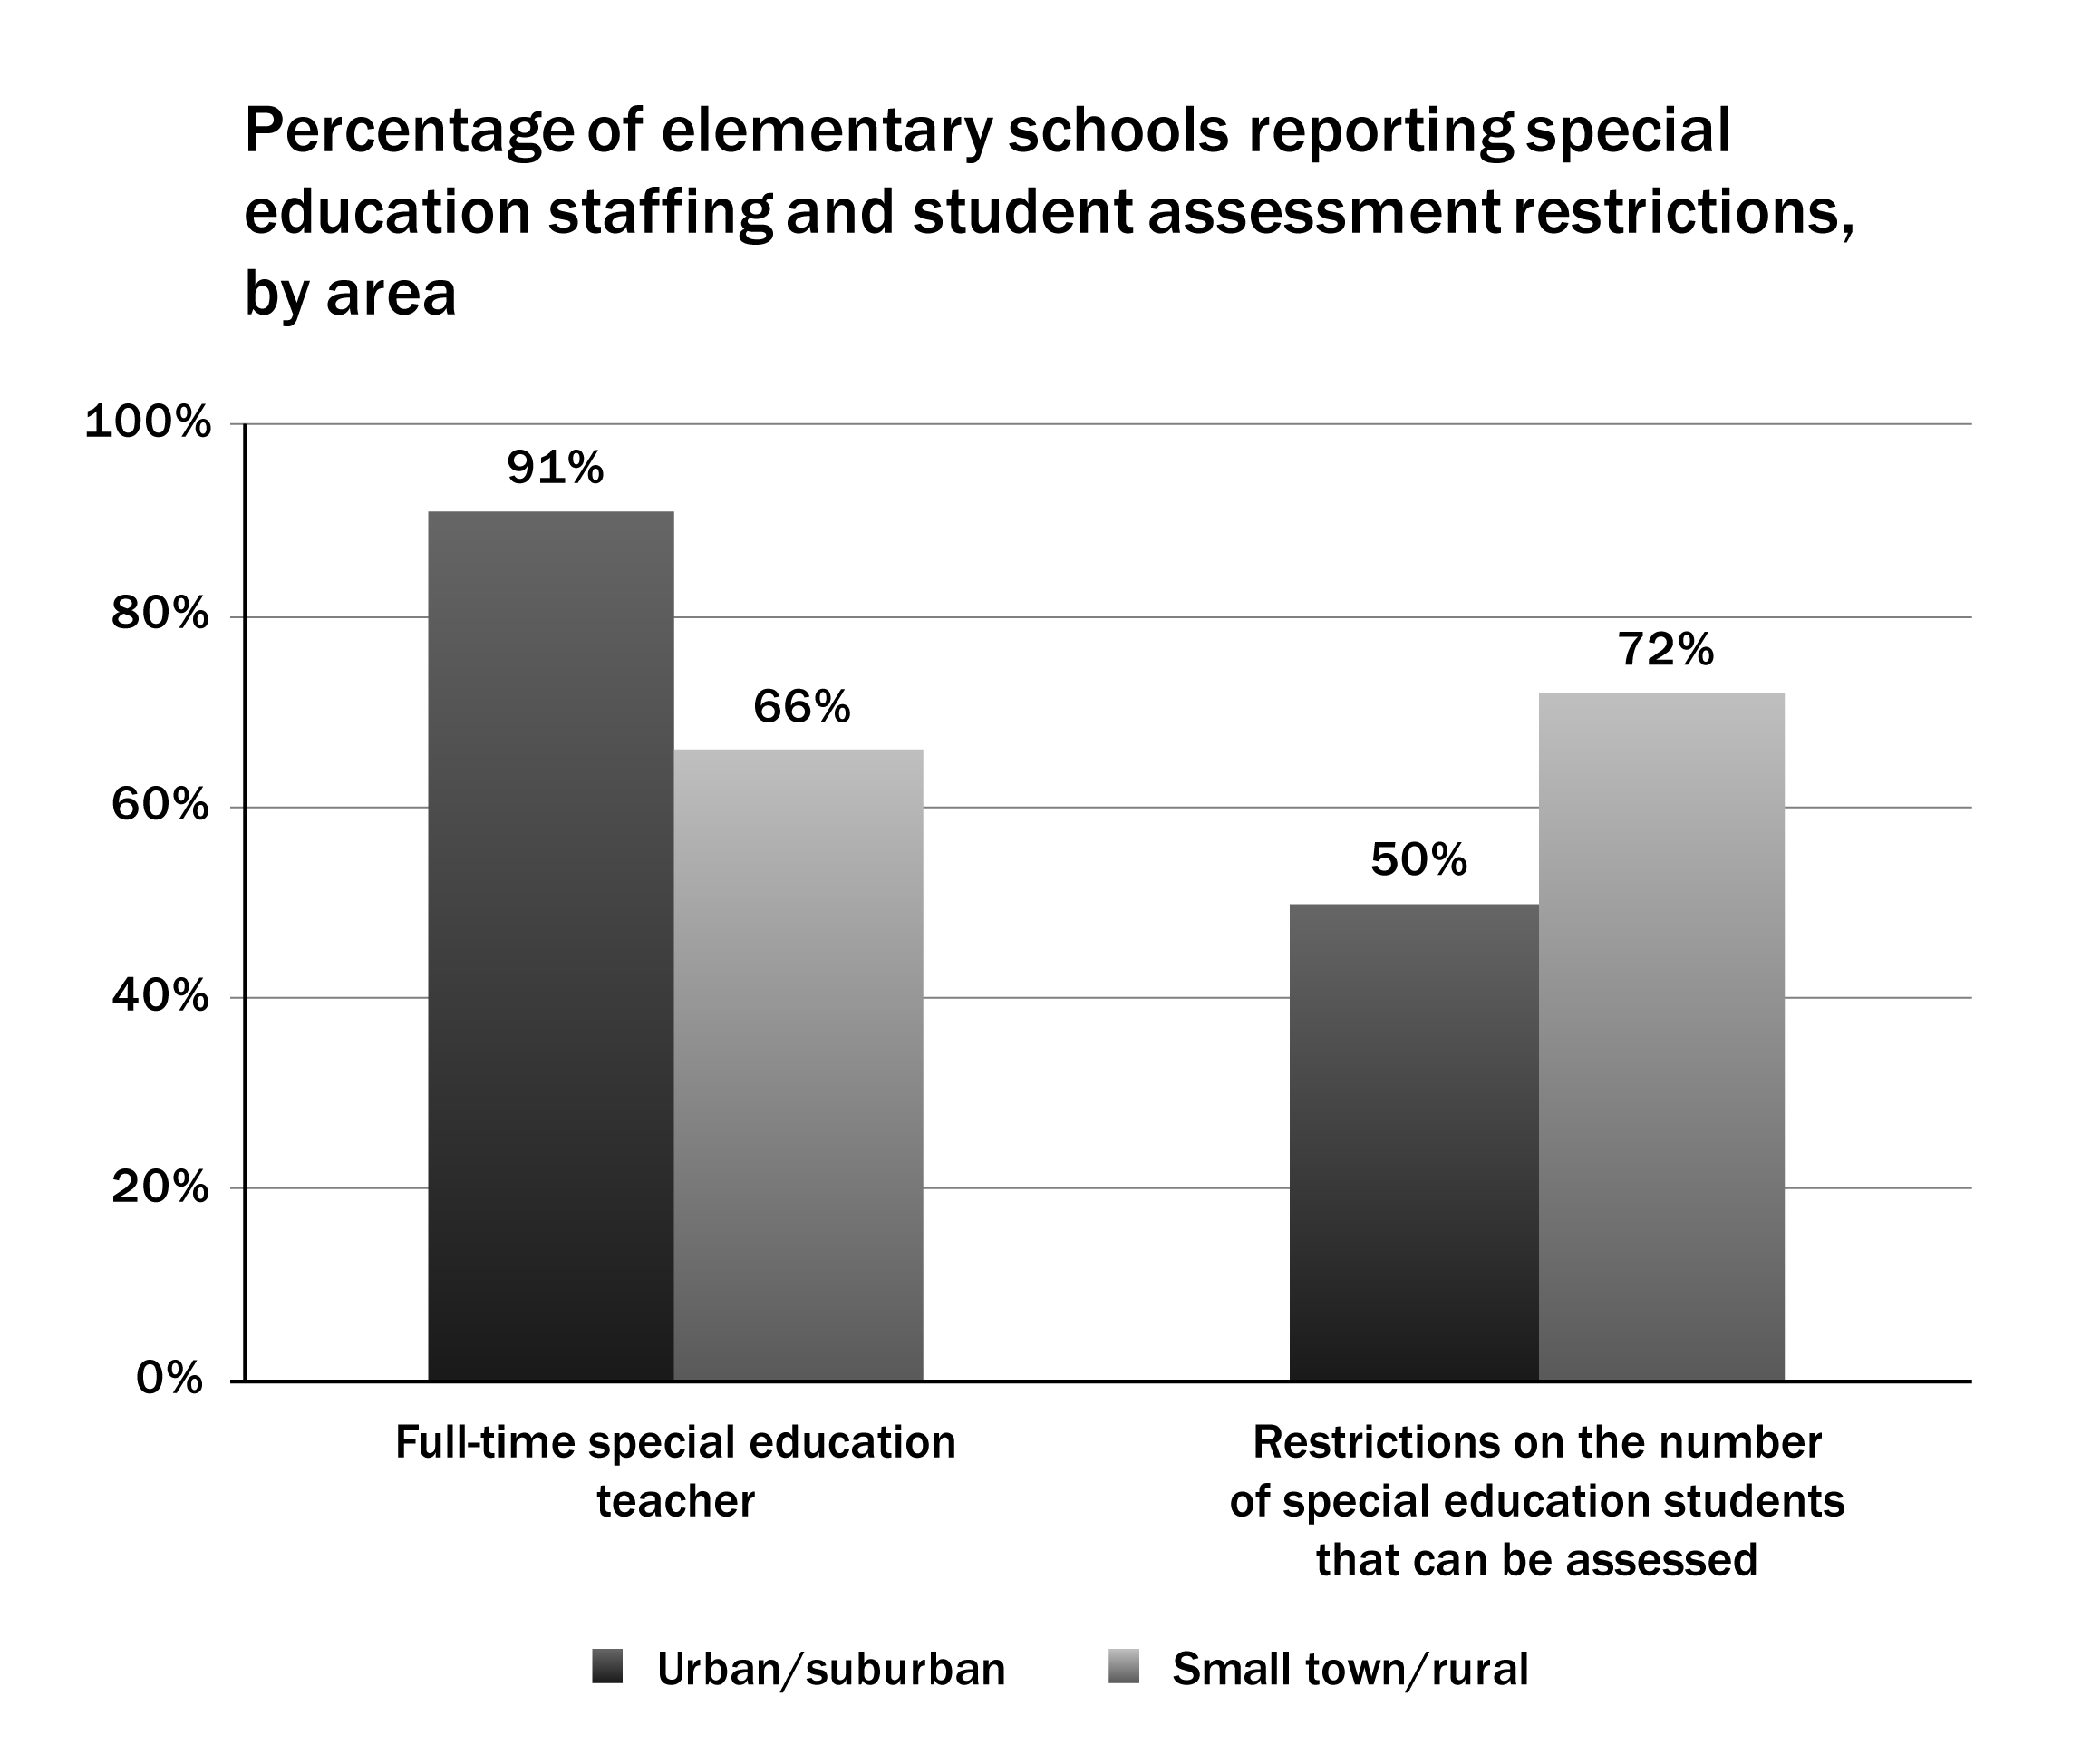
Prior to the IPRC process, the student may be required to undergo a psycho-educational assessment conducted by a psychologist or other trained professional. The assessment provides more information about the nature of the student’s learning challenges and the types of support that may help. If the school cannot provide an assessment in a timely manner, parents may choose to pay for one privately. Private assessments can cost more than $2,500.59 When parents pay privately, they avoid waiting lists, which can range from months to years. Children on waiting lists may be going without the early support that can have an impact on their chances for long-term success.60
In 2016:
- The percentage of elementary schools reporting that not all students are receiving recommended support has increased to 26% from 22% last year.
- Elementary and secondary schools have an average of 6 students per school waiting for an assessment.
- 59% of elementary and 52% of secondary schools report that there are restrictions on the number of students they can place on waiting lists for assessments.
- Restrictions on assessments are highest in elementary schools in small town/rural areas, where 72% of schools report them, as compared with 50% in urban/suburban areas.
Nous avons plusieurs élèves avec des défis au niveau du comportement. Toutes notre énergie est souvent mise là. Ça va de même pour les évaluations psycho éducationnelles. On pourrait passer une dizaines d’élèves en évaluation et je crois que nous aurions des diagnostiques au niveau d’apprentissage ou de comportement qui mèneraient à des placement.
Elementary school, CSDC Centre-Sud61
Educational assistants
Ninety-five percent of secondary and 91 percent of elementary schools have educational assistants in special education. These assistants provide support in both regular classrooms and special education classes. They work with students individually or in groups, under the guidance of the teacher. Their responsibilities include everything from helping students with lessons to assisting with personal hygiene or behavioural modification.
The qualifications required for educational assistants vary from board to board, however only 36% of elementary and 59% of secondary schools report that the majority of their educational assistants have an additional post-secondary qualification in special education.
Challenges in special education
In their comments, principals identify many challenges in meeting students’ needs, including a lack of staff or funding; the amount of paperwork associated with special education; problems with accessing assessments due to backlogs, restrictions, or long wait times; and behaviour and mental health concerns that take substantial time away from providing academic support. In recent consultations on education funding conducted by the Ministry of Education, school boards and a range of stakeholders, including principals, teachers, parents, and board staff, raised similar concerns.62
[The challenge is that] teachers are unable to consistently meet the needs of all of their students (due to lack of experience, training and knowledge, and the sheer diversity of student needs) and special education teachers are restricted in the amount of support that they can provide due to time constraints (only 1 teacher and 1 EA).
Elementary school, Bluewater DSB
Changes to Ontario’s special education funding formula
The province estimates it will spend $2.76 billion on special education next year. Half of this is provided through a Special Education Per-Pupil Amount (SEPPA) that is based on the total number of students in the school board.63 The SEPPA funds the additional assistance that the majority of special education students require—including everything from educational assistants to psycho-educational consultants, special education teachers and a range of classroom supports.
The remainder of special education funding is intended to cover the cost of things like special equipment and facilities, separate classrooms, special education teachers, and other supports for students with higher needs.64 In an effort to make the funding more responsive to boards’ and students’ needs, the Ministry has been implementing a new funding model focused on students with higher needs. The new funding model is calculated, for the most part, based on two factors:
- a Special Education Statistical Prediction Model that uses demographic data to estimate the total number of students likely to receive special education supports; and
- a formula for ‘Measures of Variability’ which takes into account other local factors, such as percentage of students exempted from EQAO tests, remoteness, percentage of students currently receiving special education supports, estimated percentage of students who are First Nations, Métis or Inuit, and numbers of locally developed courses or alternative credits offered by the board.
Teacher education to support all students with special needs
Comments from the survey identify the need for better educational supports so that teachers can meet the broad diversity of learning needs in today’s classrooms. One principal suggests, “all teachers should have [a special education] background.”65 A report on special education prepared for Ontario’s Ministry of Education states that as more students with special education needs are accommodated within regular classrooms, providing all teachers with special education training is essential for inclusive education to be effective.66
Urban/suburban vs. Small town/rural
Special Education support is not evenly divided throughout school boards in Ontario.
In 2016:
- 91% of urban/suburban elementary schools report having a full-time special education teacher, compared to only 66% in small town/rural schools.
- 50% of urban/suburban elementary schools report a restriction on the number of students who can receive special education assessments. That number jumps to 72% in small town/rural schools.
[We] need MORE psycho-educational assessments. In more affluent schools, where parents are working and have coverage, they make up for the lack of assessments by having parents pay privately, which frees up assessments for the children who are left. When you work in a less affluent school there are often more students who need the assessment, fewer parents who can afford to go privately, and there are not nearly enough assessments to go around.
Elementary school, Upper Grand DSB
Quick Facts
- 29% of elementary schools and 49% of secondary schools report Indigenous guest speakers.
- 31% of elementary schools and 53% of secondary schools offer professional development opportunities on Indigenous cultural issues to staff.
While public attention is most often focused on the challenges faced by on-reserve schools, it is less well-known that in Ontario, 82% of First Nations, Métis, and Inuit students attend provincially funded schools.67
For a number of years, Ontario’s Ministry of Education and Ontario school boards have focused on two priorities: improving Indigenous students’ chances for success, and increasing all students’ access to a strong Indigenous education.68 In 2015, in its “Calls to Action,” Canada’s Truth and Reconciliation Commission (TRC) provided a number of concrete ways to achieve these goals.69 The Calls to Action outlined the changes that provinces need to make in order to support the integration of Indigenous knowledge and teaching methods into the classroom.
While there has been marked progress toward embedding Indigenous education into Ontario’s schools, there are still challenges to be addressed.
Educational opportunities and community connections
In an extensive consultation conducted by the Provincial Advocate for Children and Youth, Indigenous young people said they wanted traditions and teachings from elders to be part of their educational experience.70 According to Indigenous education researcher Susan Dion, this access increases “opportunities for teachers and students to learn from Aboriginal people” and increases “First Nations, Métis, and Inuit students’ experiences of belonging and well-being in schools.”71 Parent engagement also increases when stronger ties between schools and communities exist.72
Responses to this year’s survey show that more Indigenous guest speakers are being invited into schools at both elementary and secondary levels, and that there has been an increase in the percentage of secondary schools consulting with Indigenous community members (see Table 2).
Table 2
Schools offering Indigenous education opportunities |
|||
| 2014 | 2015 | 2016 | |
| Indigenous guest speakers | |||
| Elementary | 23% | 20% | 29% |
| Secondary | 39% | 45% | 49% |
| Consultation with Indigenous community members | |||
| Elementary | 12% | 10% | 13% |
| Secondary | 27% | 27% | 38% |
While these positive changes are worth celebrating, concerns persist. The majority of schools do not offer any Indigenous education activities, and urban regions lag behind rural areas in providing Indigenous education and supports. Furthermore, some principals commented that their schools had too few First Nations, Métis, or Inuit students to warrant a specific focus on Indigenous education.
In 2016:
- Only 10% of elementary schools offer Indigenous cultural ceremonies, and only 6% offer Native Studies programs.
- 30% of secondary schools report Indigenous cultural ceremonies, but only 11% report language programs, which has remained consistent for the past two years.
- 23% of secondary schools provide post-secondary outreach with a focus on Indigenous students.
Supporting teachers’ professional development
For teachers who are not familiar with Indigenous literature or First Nations, Métis, and Inuit cultures and histories, integrating Indigenous content into their courses can be overwhelming. Professional development can play a vital role in transforming their classrooms and their teaching practices.73
In 2016:
- 31% of elementary schools now offer professional development opportunities on Indigenous cultural issues to staff, compared to 25% in 2014 (see Figure 13).
- 53% of secondary schools offer professional development, compared to 34% in 2014.
- Only 15% of elementary and 35% of secondary schools report that they have a designated staff member (other than the principal or vice principal) who coordinates Indigenous education in their school.
- Of the elementary and secondary schools reporting no designated staff, more than 85% report having access to staff support from their school board.
Figure 13
Addressing identified goals
In 2007, Ontario’s Ministry of Education introduced its First Nation, Métis and Inuit Education Policy Framework, which identifies specific goals aimed at closing both the achievement gap for Indigenous students and the knowledge gap experienced by all students.74 The Ministry set 2016 as its target date for closing the gap between Aboriginal and non-Aboriginal students in literacy, numeracy, student retention, graduation rates and pursuit of post-secondary education, and providing Aboriginal education opportunities for all students.75
In spite of programming and monetary investments, these goals appear to be unachievable by the Ministry’s target date. Achievement levels for most Indigenous students remain below that of their non-Indigenous peers,76 with the most recent available data from the Education Quality and Accountability Office (2011/12) showing a gap of more than 20 percentage points on reading, writing and math test scores between First Nations students and all students in English language school boards.77 The fact that the majority of schools do not offer other Indigenous education supports and programs also limits their capacity to reach the Ministry goals.
Indigenizing education
While there are signs of progress in Indigenous education, the biggest challenge may be the true Indigenization of education. Indigenizing education is not merely a matter of ensuring that Indigenous students have specialized programs and services; it requires learning environments that go beyond brief cultural experiences to include far broader expressions of Indigenous identity. In a truly Indigenized system, Indigenous concepts and ways of viewing the world are woven into the entire curriculum, rather than delivered as stand-alone curriculum expectations.78 This requires reconceiving learning environments so that physical, emotional, intellectual, and spiritual elements are valued in addition to literacy and numeracy.79
Nous aimerions bien avoir des personnes ressources qui viennent faire des cérémonies et servir de mentors auprès de nos jeunes Autochtones, Métis et pour la population en général.
Elementary school, CSD du Grand Nord de l’Ontario80
Some principals expressed concern that their schools contained too few Indigenous students to warrant a specific focus on Indigenous education. As one principal stated, “Small numbers mean limited interest or perceived need.”81 Yet, as Dion, Johnston, and Rice have shown, all students benefit from a better understanding of Canada’s history of colonization and its influence upon current relationships between Indigenous and non-Indigenous people.82 One promising option at the secondary level is the granting of a compulsory English credit to students who take the grade 11 Contemporary Aboriginal Voices English course.83
Through collaborating with our Board’s First Nations Resource teacher, our grade 5 students and teachers were able to engage in authentic learning experiences.
Elementary school, Peel DSB
The impact of funding and student numbers on Indigenous education programs
In the 2016 surveys, some principals commented that they did not receive as much funding for Indigenous cultural opportunities as schools with higher Indigenous populations. This may be a result of targeted funding in the First Nation, Métis and Inuit Education Supplement84 that provides a base amount to all school boards to support implementation of the FNMI Education Policy Framework, plus additional support for boards with higher proportions of First Nations, Métis and Inuit students.
Since the person who carries the Aboriginal portfolio also has numerous other responsibilities, and our school would not be a priority school, I feel as though we are missing out on many wonderful learning opportunities for the Aboriginal students within our building.
Elementary school, Superior North CDSB
In the 2016/17 school year, school boards will receive $64 million to support First Nation, Métis and Inuit education.85 For the first time this year, the Ministry has included a requirement that a portion of the funding in the basic per-pupil allocation must be used to establish a supervisory officer-level position focused on the implementation of the Ontario First Nation, Métis, and Inuit Education Policy Framework. Responsibilities will include “working with First Nation, Métis, and Inuit communities, organizations, students and families…supporting programs to build the knowledge and awareness of all students about Indigenous histories, cultures, perspectives and contributions; and supporting implementation of Indigenous self-identification policies in each board.”86 Boards are not only required to spend at least half of the targeted amount on this dedicated position, but they must also confirm that any remaining amount has been used to support the First Nation, Métis and Inuit Education Policy Framework.
This year the Ministry will also begin to phase in data from the 2011 National Household Survey, which will be used to allocate the per-pupil funding amount. In addition, 45% of the funding for the Board Action Plans required by the Ministry will be allocated based on voluntary Indigenous student self-identification. By the end of the phase-in period, it is expected that the 2016 census data will be available for use in implementing further updates. More accurate demographic data will help to ensure that funding is allocated where it is needed.
We work in grade teams to provide educational opportunities for all students on Aboriginal perspectives and culture. We have a community member who will be working with the staff on the Medicine Wheel teachings and the Seven Sacred Teachings.
Elementary school, Toronto DSB
Unless cited from other sources, the statistics and quoted material in this report originate from People for Education’s 19th Annual Survey (2015/16) of Ontario’s elementary schools, and 16th Annual Survey of Ontario’s secondary schools. The surveys were mailed to principals in every publicly funded school in Ontario during the fall of 2015. Schools in French language school boards received translated surveys. Surveys were also available for completion online in English and French.
This year we received 1,154 responses from elementary and secondary schools, covering each of Ontario’s 72 publicly funded school boards, and 24% of the province’s publicly funded schools. The responses also offer a largely representative sample of publicly funded schools across provincial regions (see Figure 14). All survey responses and data are confidential and stored in conjunction with Tri-Council recommendations for the safeguarding of data.
Figure 14
Regional data |
||
| Region (sorted by postal code) | % of schools in survey | % of schools in Ontario |
| Eastern Ontario (K) | 19% | 18% |
| Central Ontario without GTA | 16% | 17% |
| GTA | 33% | 34% |
| Southwestern Ontario (N) | 20% | 20% |
| Northern Ontario (P) | 13% | 11% |
Data Analysis
The analyses in this report are based on both descriptive and inferential statistics. The chief objective of descriptive analyses is to present numerical information in an illuminating format that is accessible to multiple audiences. All data were analyzed using SPSS statistical software.
For geographic comparisons, schools were classified as either small town/rural or urban/suburban using postal codes. Small town/rural schools are located in jurisdictions with under 75,000 people and not contiguous to an urban centre greater than 75,000 people. All other schools were classified as urban/suburban schools. Based on scholarly literature and governmental sources, it was determined that a population of 75,000 persons provided the most accurate dividing line between small town/rural and urban/suburban areas in the Ontario provincial context.
Reporting
Calculations have been rounded to the nearest whole number and may not amount to 100%. The average student to staff ratio was calculated for schools that reported both the total number of students and the full-time equivalents for
staff positions.
In Ontario, funding for education and child care is overseen by the provincial government.
The Ministry of Education makes decisions about how much money will be spent on education overall, and allocates funding to school boards based on a provincial funding formula. Specific decisions about how to spend the provincial funding are made by school boards and by school principals.
The funding formula
Since the provincial funding formula was first developed in 1997, many adjustments have been made, including changes to recognize the unique needs of boards with a high number of small schools, adjustments to funding for special education, and funding to cushion the blow of declining enrolment. But much of education funding continues to be tied
to enrolment.
Funding for classroom teachers, education assistants, textbooks and learning materials, classroom supplies, classroom computers, library and guidance services, preparation time (which funds specialist and student success teachers), professional and para-professional supports, and textbooks is allocated on a per-pupil basis. (E.g. for every 763 elementary students, the province provides funding for one teacher–librarian; for every 385 secondary students, the province provides funding for one guidance counsellor).
Principals, vice principals, school secretaries, and school office supplies are funded according to a formula based both on numbers of students and numbers of schools.
Funding to heat, light, maintain and repair schools also depends on student numbers. There is funding to maintain 104 square feet per elementary student, 130 square feet per secondary student and 100 square feet per adult education student. There is also some “top up” funding for schools that are just below the provincially-designated capacity.
Per-pupil funding is not meant to be equal, as different boards have different needs. But it is meant to provide equal educational opportunity for all students. To accomplish this, other specific grants are added to the per-pupil base that boards receive, including grants for special education, English or French language support, transportation, declining enrolment, learning opportunities, etc.
Where are the decisions made?
The province
The Ministry of Education provides funding to school boards based on a number of factors, including the number of students in a board, the number of schools, the percentage of high needs special education students, the number of students who have either English or French as their second language, and unique geographical needs (a high number of small schools, very far apart, for example).
But only special education, capital funding, components of the Learning Opportunities Grant, and the First Nations, Métis and Inuit Grant are “sweatered,” meaning funds provided cannot be spent on anything else. Most other funding can be moved from one category to another, which means that many funding decisions are made at the board level.
The school board
School boards make decisions about individual schools’ budgets and on criteria for things like the number of students a school must have in order to get staff such as teacher–librarians or vice-principals. Boards distribute funding for teachers to schools depending on the number of students and, in some cases, depending on the number of students who might struggle to succeed—either because of socio-economic or ethno-racial factors, or because of special needs. Boards also decide which schools should stay open and which should close, and how many custodians, secretaries and educational assistants each school will get.
The school
Principals receive a budget for the school from the school board. They make decisions about school maintenance and repairs within that budget, and about the distribution of teachers and class sizes. They decide how to allocate educational assistants and whether their school can have staff such as a teacher–librarian, a music teacher, or department heads. Depending on the size of the school, principals may also allocate funding to different departments.
- Ministry of Education, Ontario. (2016). Education Funding: Technical Paper 2016-17. Ontario: Queen’s Printer. Retrieved from http://www.edu.gov.on.ca/eng/funding/1617/2016_technical_paper_en.pdf.
- People for Education. (2014). Measuring What Matters: Beyond the 3 “R’s”. In Measuring What Matters, People for Education. Toronto: November 8, 2014. Retrieved from http://www.peopleforeducation.ca/measuring-what-matters/wp-content/uploads/2014/11/People-for-Education-Measuring-What-Matters-Beyond-the-3-Rs1.pdf.
- Ministry of Education, Ontario. (2015). The Ontario Curriculum Grades 1-8: Health and Physical Education. Ontario: Queen’s Printer. Retrieved from http://www.edu.gov.on.ca/eng/curriculum/elementary/health1to8.pdf, pg. 9.
- Ferguson, B. and Power, K. (2014). Broader Measures of Success: Physical and Mental Health in Schools. In Measuring What Matters, People for Education. Toronto: November 8, 2014. Retrieved from http://www.peopleforeducation.ca/measuring-what-matters/wp-content/uploads/2014/11/People-for-Education-Measuring-What-Matters-physical-and-mental-health-2014.pdf.
- Ibid.
- Ministry of Education, Ontario. (2016). Foundations for a Healthy School: Promoting well-being is part of Ontario’s Achieving Excellence vision. Ontario: Queen’s Printer. Retrieved from http://www.edu.gov.on.ca/eng/healthyschools/foundations.html; Ferguson, B. and Power, K. (2014). Broader Measures of Success: Physical and Mental Health in Schools. In Measuring What Matters, People for Education. Toronto: November 8, 2014. Retrieved from http://www.peopleforeducation.ca/measuring-what-matters/wp-content/uploads/2014/11/People-for-Education-Measuring-What-Matters-physical-and-mental-health-2014.pdf.
- Ministry of Education, Ontario. (2016). Foundations for a Healthy School: Promoting well-being is part of Ontario’s Achieving Excellence vision. Ontario: Queen’s Printer. Retrieved from http://www.edu.gov.on.ca/eng/healthyschools/foundations.html.
- Office of the Auditor General of Ontario. (2015). Healthy Schools Strategy. Toronto: Government of Ontario. Retrieved from http://www.auditor.on.ca/en/content/annualreports/arreports/en15/4.03en15.pdf.
- Ibid.
- Ibid.
- Ibid. pg. 605.
- Ministry of Education, Ontario. (2015). The Ontario Curriculum Grades 1-8: Health and Physical Education. Ontario: Queen’s Printer. Retrieved from http://www.edu.gov.on.ca/eng/curriculum/elementary/health1to8.pdf, pg. 9.
- Office of the Auditor General of Ontario. (2015). Healthy Schools Strategy. Toronto: Government of Ontario. Retrieved from http://www.auditor.on.ca/en/content/annualreports/arreports/en15/4.03en15.pdf; Ferguson, B. and Power, K. (2014). Broader Measures of Success: Physical and Mental Health in Schools. In Measuring What Matters, People for Education. Toronto: November 8, 2014. Retrieved from http://www.peopleforeducation.ca/measuring-what-matters/wp-content/uploads/2014/11/People-for-Education-Measuring-What-Matters-physical-and-mental-health-2014.pdf.
- People for Education. (2011). Health and Physical Education in Schools. Toronto: People for Education. Retrieved from http://www.peopleforeducation.ca/wp-content/uploads/2011/07/Health-and-Physical-Education-in-Schools-2011.pdf.
- Ministry of Education, Ontario. (2016). Education Funding: Technical Paper 2016-17. Ontario: Queen’s Printer. Retrieved from http://www.edu.gov.on.ca/eng/funding/1617/2016_technical_paper_en.pdf.
- Rowling, L. & Weist, M. D. (2004). Promoting the Growth, Improvement and Sustainability of School Mental Health Programs Worldwide. International Journal of Mental Health Promotion, 6(2), 3-11; Ferguson, B. and Power, K. (2014). Broader Measures of Success: Physical and Mental Health in Schools. In Measuring What Matters, People for Education. Toronto: November 8, 2014. Retrieved from http://www.peopleforeducation.ca/measuring-what-matters/wp-content/uploads/2014/11/People-for-Education-Measuring-What-Matters-physical-and-mental-health-2014.pdf.
- Toronto District School Board. (2014). Social Workers and Attendance Counselors. Retrieved from http://www.tdsb.on.ca/AboutUs/ProfessionalSupportServices/SocialWorkandAttendanceServices.aspx.
- Rowling, L. & Weist, M. D. (2004). Promoting the Growth, Improvement and Sustainability of School Mental Health Programs Worldwide. International Journal of Mental Health Promotion, 6(2), 3-11 cited in Ferguson, B. and Power, K. (2014). Broader Measures of Success: Physical and Mental Health in Schools. In Measuring What Matters, People for Education. Toronto: November 8, 2014.
- English Translation: [There are more children in need, but services are not growing].
- Ministry of Education, Ontario. (2016). Education Funding: Technical Paper 2016-17. Ontario: Queen’s Printer. Retrieved from http://www.edu.gov.on.ca/eng/funding/1617/2016_technical_paper_en.pdf.
- Payscale Inc. (2016). Psychologist Salary (Canada). Retrieved April 11, 2016, from http://www.payscale.com/research/CA/Job=Psychologist/Salary; Payscale Inc. (2016). Social Worker Salary (Canada). Retrieved from http://www.payscale.com/research/CA/Job=Social_Worker/Salary; Payscale Inc. (2016). Child and Youth Worker Salary (Canada). Retrieved April 29, 2016 from http://www.payscale.com/research/CA/Job=Child_and_Youth_Worker/Hourly_Rate.
- Upitis, R. (2011). Engaging Students through the Arts. Retrieved from https://www.edu.gov.on.ca/eng/literacynumeracy/inspire/research/WW_Engaging_Arts.pdf.
- People for Education. (2014). Measuring What Matters: Beyond the 3 “R’s”. In Measuring What Matters, People for Education. Toronto: November 8, 2014. Retrieved from http://www.peopleforeducation.ca/measuring-what-matters/wp-content/uploads/2014/11/People-for-Education-Measuring-What-Matters-Beyond-the-3-Rs1.pdf.
- People for Education. (2014). Public Education: Our Best Investment (Annual Report on Ontario’s Publicly Funded Schools 2014). Toronto: People for Education. Retrieved from http://www.peopleforeducation.ca/wp-content/uploads/2014/06/annual-report-2014-WEB.pdf.
- Ministry of Education, Ontario. (2009). The Ontario Curriculum (Grades 1-8): The Arts. Ontario: Queen’s Printer. Retrieved from https://www.edu.gov.on.ca/eng/curriculum/elementary/arts18b09curr.pdf; Ministry of Education. (2010). Growing Success: Assessment, Evaluation, and Report in Ontario Schools. Ontario: Queen’s Printer. Retrieved from https://www.edu.gov.on.ca/eng/policyfunding/growSuccess.pdf.
- Ibid.
- Ibid.
- People for Education. (2013) The Arts in Ontario School. Toronto: People for Education. Retrieved from http://www.peopleforeducation.ca/wp-content/uploads/2011/12/People-for-Education-report-on-the-arts-in-schools-April-2013.pdf.
- Ministry of Education, Ontario. (2014). Achieving Excellence: A Renewed Vision for Education in Ontario. Ontario: Queen’s Printer. Retrieved from http://www.edu.gov.on.ca/eng/about/renewedVision.pdf, pg. 6.
- People for Education. (2013). The Arts in Ontario School. Retrieved from http://www.peopleforeducation.ca/wp-content/uploads/2011/12/People-for-Education-report-on-the-arts-in-schools-April-2013.pdf; Upitis, R. (2011). Engaging Students through the Arts. Retrieved from https://www.edu.gov.on.ca/eng/literacynumeracy/inspire/research/WW_Engaging_Arts.pdf.
- Ministry of Education, Ontario. (2013). The Ontario Curriculum: Social Studies (Grades 1-6) and Geography (Grades 7 & 8). Ontario: Queen’s Printer. Retrieved from https://www.edu.gov.on.ca/eng/curriculum/elementary/sshg18curr2013.pdf.
- Ministry of Education, Ontario. (2013). The Ontario Curriculum: Social Studies (Grades 1-6) and Geography (Grades 7 & 8). Ontario: Queen’s Printer. Retrieved from https://www.edu.gov.on.ca/eng/curriculum/elementary/sshg18curr2013.pdf; People for Education. (2013). Libraries: A report from People for Education. Retrieved from http://www.peopleforeducation.ca/wp-content/uploads/2013/01/libraries.pdf; James, N., Shamchuk, L., & Koch, K. (2015). Changing Roles of Librarians and Library Technicians. Partnership: The Canadian Journal of Library and Information Practice and Research, 10(2).
- Ontario Library Association. (2010). Together for Learning: School libraries and the emergence of the learning commons. Retrieved from https://www.accessola.org/web/Documents/OLA/Divisions/OSLA/TogetherforLearning.pdf.
- Ibid.
- Ministry of Education, Ontario. (2013). The Ontario Curriculum: Social Studies (Grades 1-6) and Geography (Grades 7 & 8). Ontario: Queen’s Printer. Retrieved from https://www.edu.gov.on.ca/eng/curriculum/elementary/sshg18curr2013.pdf.
- Ontario Library Association. (2015). Ontario library association emphasizes importance of teacher–librarians as school program cuts loom. Retrieved from https://www.accessola.org/web/Documents/OLA/issues/2015/OLA-Emphasizes-Importance-Teacher-Librarians.pdf; Rushowy, K. (2015, March 25). Toronto Catholic Board cuts include teacher–librarians. Toronto Star. Retrieved from http://www.thestar.com/news/gta/2015/03/25/toronto-catholic-board-cuts-include-teacher–librarians.html.
- Ontario Library Association. (n.d.). Cuts to libraries. Retrived from http://www.accessola.org/web/OLA/ADVOCACY/General_Library_Issues/Cuts_to_Libraries/OLA/Issues_Advocacy/issues/Unprecedented_number_of_cuts_to_library_programs_in_Canada.aspx?hkey=850bf28c-4e4f-4f92-b59d-76f4c69ecd3c.
- Ministry of Education, Ontario. (2014). Achieving Excellence: A Renewed Vision in Education in Ontario. Ontario: Queen’s Printer. Retrieved from http://www.edu.gov.on.ca/eng/about/renewedVision.pdf.
- Ministry of Education, Ontario. (2016). Education Funding: Technical Paper 2016-17. Ontario: Queen’s Printer. Retrieved from http://www.edu.gov.on.ca/eng/funding/1617/2016_technical_paper_en.pdf.
- Payscale Inc. (2016). Library Technician. Retrieved from http://www.payscale.com/research/CA/Job=Library_Technician/Hourly_Rate.
- Canadian Library Association. (2011). Guidelines for the Evaluation of Library Technicians. Retrieved from http://cla.ca/wp-content/uploads/CLA_LTIG_guidelines.pdf.
- James, N., Shamchuk, L., & Koch, K. (2015). Changing Roles of Librarians and Library Technicians. Partnership: The Canadian Journal of Library and Information Practice and Research, 10(2).
- Ontario Library Association. (2015). Ontario library association emphasizes importance of teacher–librarians as school program cuts loom. Retrieved from https://www.accessola.org/web/Documents/OLA/issues/2015/OLA-Emphasizes-Importance-Teacher-Librarians.pdf.
- Ministry of Education, Ontario. (2013). Creating Pathways to Success: An Education and Career/life Planning Program for Ontario Schools. Ontario: Queen’s Printer. Retrieved from http://www.edu.gov.on.ca/eng/document/policy/cps/creatingpathwayssuccess.pdf.
- Ministry of Education, Ontario. (2014). Achieving Excellence: A Renewed Vision for Education in Ontario. Ontario: Queen’s Printer. Retrieved from http://www.edu.gov.on.ca/eng/about/renewedVision.pdf; Ministry of Education and Training, Ontario. (1999). Choice into Action: Guidance and Career Education Program Policy for Ontario Elementary and Secondary Schools. Ontario: Queen’s Printer. Retrieved from http://www.ycdsb.ca/programs-services/SCP/documents/choicee.pdf; Ministry of Education, Ontario. (2013). Creating Pathways to Success: An Education and Career/life Planning Program for Ontario Schools. Ontario: Queen’s Printer. Retrieved from http://www.edu.gov.on.ca/eng/document/policy/cps/creatingpathwayssuccess.pdf; Ministry of Education, Ontario. (2010). Growing Success. Ontario: Queen’s Printer. Retrieved from https://www.edu.gov.on.ca/eng/policyfunding/growSuccess.pdf.
- Ministry of Education and Training, Ontario. (1999). Choice into Action: Guidance and Career Education Program Policy for Ontario Elementary and Secondary Schools. Ontario: Queen’s Printer. Retrieved from http://www.ycdsb.ca/programs-services/SCP/documents/choicee.pdf; Ministry of Education, Ontario. (2013). Creating Pathways to Success: An Education and Career/life Planning Program for Ontario Schools. Ontario: Queen’s Printer. Retrieved from http://www.edu.gov.on.ca/eng/document/policy/cps/creatingpathwayssuccess.pdf.
- Ministry of Education, Ontario. (2013). Supporting Minds: An Educator’s Guide to Supporting Mental Health and Well-being. Ontario: Queen’s Printer. Retrieved from https://www.edu.gov.on.ca/eng/document/reports/SupportingMinds.pdf.
- Ibid.
- Employment Ontario. (2013). 4143 Educational counsellors. Retrieved from http://www.tcu.gov.on.ca/eng/labourmarket/ojf/pdf/4143_e.pdf; Employment Ontario. (2013). 4143 Educational counsellors. Retrieved from http://www.tcu.gov.on.ca/eng/labourmarket/ojf/pdf/4143_e.pdf.
- Ontario School Counsellors’ Association (n.d). The role of the guidance-teacher counsellor. Retrieved from https://www.osca.ca/en.html.
- Ministry of Education, Ontario. (2013). Creating Pathways to Success: An Education and Career/life Planning Program for Ontario Schools. Ontario: Queen’s Printer. Retrieved from http://www.edu.gov.on.ca/eng/document/policy/cps/creatingpathwayssuccess.pdf.
- Ontario Ministry of Education. (2013). Supporting Transitions for Students with Special Needs. Ontario: Queen’s Printer. Retrieved from https://www.edu.gov.on.ca/extra/eng/ppm/ppm156.pdf.
- Hamlin, D. and Cameron, D. (2015). Applied or Academic: High Impact Decisions for Ontario Students. People for Education. Toronto, ON. Retrieved from http://www.peopleforeducation.ca/wp-content/uploads/2015/04/People-for-Education-Applied-or-Academic-Report-2015.pdf; Parekh, G. (2014). Social Citizenship and disability: Identity, belonging, and the structural organization of education. York University, Toronto, Ontario; Tilleczek, K., Laflamme, S., Ferguson, B., Edney, D.R., Girard, M., Cudney, D., & Cardoso, S. (2010). Fresh starts and false starts: Young people in transition from elementary to secondary school. Report prepared for Ontario Ministry of Education, Toronto, ON.
- Hamlin, D. and Cameron, D. (2015). Applied or Academic: High Impact Decisions for Ontario Students. People for Education. Toronto, ON. Retrieved from http://www.peopleforeducation.ca/wp-content/uploads/2015/04/People-for-Education-Applied-or-Academic-Report-2015.pdf; Parekh, G. (2014). Social Citizenship and disability: Identity, belonging, and the structural organization of education. York University, Toronto, Ontario; Tilleczek, K., Laflamme, S., Ferguson, B., Edney, D.R., Girard, M., Cudney, D., & Cardoso, S. (2010). Fresh starts and false starts: Young people in transition from elementary to secondary school. Report prepared for Ontario Ministry of Education, Toronto, ON; Nadon, D. (2014). Perceptions of Be(com)ing a Guidance Counsellor in Ontario: A Qualitative Inquiry. University of Ottawa. Ottawa, Ontario.
- Ministry of Education, Ontario. (2012). The Education Act. Ontario: Queen’s Printer. Retrieved from http://www.edu.gov.on.ca/eng/general/elemsec/speced/edact.html.
- Ministry of Education, Ontario. (2016). Introduction to Special Education in Ontario. Ontario: Queen’s Printer. Retrieved from http://www.edu.gov.on.ca/eng/general/elemsec/speced/ontario.html.
- Ministry of Education, Ontario. (2014). An Overview of Special Education. [PowerPoint slides].
- Ministry of Education, Ontario. (2007). The Identification, Placement, and Review Committee. Ontario: Queen’s Printer. Retrieved from http://www.edu.gov.on.ca/eng/general/elemsec/speced/identifi.html.
- People for Education. (2012). Annual Report on Ontario’s Publicly Funded Schools. Retrieved from http://www.peopleforeducation.ca/wp-content/uploads/2012/05/annual-Report-2012-web.pdf.
- People for Education. (2012). Special Education. Retrieved from http://www.peopleforeducation.ca/wp-content/uploads/2012/05/special-education-early-release-2012.pdf.
- English Translation: [We have several students with behavioral problems. All of our energy is often focused on them. This is the same for psycho-educational evaluations. We could run ten more students through evaluations and I believe that we would still have the diagnostic tools in learning and behaviour that would lead to placements].
- Ministry of Education, Ontario. (2016). 2016-17 Education Funding: Discussion Summary. Ontario: Queen’s Printer. Retrieved from http://www.edu.gov.on.ca/eng/funding/1617/2016_ds_en.pdf.
- Ministry of Education, Ontario. (2016). Education Funding: Technical Paper 2016-17. Ontario: Queen’s Printer. Retrieved from http://www.edu.gov.on.ca/eng/funding/1617/2016_technical_paper_en.pdf.
- Ibid.
- Elementary School, Toronto DSB.
- Bennett, S., & Dworet, D., with Weber K. (2013). Special Education in Ontario Schools (7th ed.). Niagara-on-the-Lake, ON: Highland Press; Specht, J., McGhie-Richmond, D., Loreman, T., Mirenda, P., Bennett, S., Gallagher, T., & Cloutier, S. (2016). Teaching in inclusive classrooms: Efficacy and beliefs of Canadian preservice teachers. International Journal of Inclusive Education, 20(1), 1-15.
- Ministry of Education, Ontario. (2013). A Solid Foundation: Second Progress Report on the Implementation of the Ontario First Nation, Métis, and Inuit Education Policy Framework. Ontario: Queen’s Printer. Retrieved from http://www.edu.gov.on.ca/eng/aboriginal/ASolidFoundation.pdf.
- Ministry of Education, Ontario. (2007). Building Bridges to Success for First Nations, Métis, and Inuit Students. Ontario: Queen’s Printer. Retrieved from http://www.edu.gov.on.ca/eng/aboriginal/buildBridges.pdf; Ministry of Education, Ontario. (2000). Ontario Curriculum Grades 11 and 12: Native Studies. Ontario: Queen’s Printer. Retrieved from http://www.edu.gov.on.ca/eng/curriculum/secondary/nativestudies1112curr.pdf.
- Truth and Reconciliation Commission of Canada. (2015). Truth and Reconciliation Commission of Canada: Calls to Action. Retrieved from http://www.trc.ca/websites/trcinstitution/File/2015/Findings/Calls_to_Action_English2.pdf
- Provincial Advocate for Children and Youth. (2014). Feathers of Hope: A First Nations Youth Action Plan. Retrieved from: http://cwrp.ca/sites/default/files/publications/en/Feathers_of_Hope.pdf.
- Dion, S. (2014). The Listening Stone: Learning from the Ministry of Education’s First Nation, Inuit and Métis-Focused Collaborative Inquiry Project. Toronto: Council of Ontario Directors of Education, p.4.
- Ibid.
- Dion, S. (2014). The Listening Stone: Learning from the Ministry of Education’s First Nation, Inuit and Métis-Focused Collaborative Inquiry Project. Toronto: Council of Ontario Directors of Education; Dion, S.D., Johnston, K. and Rice, C.M. (2010). Decolonizing Our Schools: Aboriginal Education in the Toronto District School Board. Toronto.
- Ministry of Education, Ontario. (2007). Ontario First Nations, Métis, and Inuit Education Policy Framework. Ontario: Queen’s Printer. Retrieved from https://www.edu.gov.on.ca/eng/aboriginal/fnmiFramework.pdf.
- Ibid.
- Ministry of Education, Ontario. (2014). Implementation Plan: Ontario First Nation, Métis and Inuit Policy Framework, Ontario. Ontario: Queen’s Printer. Retrieved from http://www2.edu.gov.on.ca/eng/aboriginal/OFNImplementationPlan.pdf.
- Ministry of Education, Ontario. (2014). Implementation Plan: Ontario First Nation, Métis and Inuit Policy Framework, Ontario. Ontario: Queen’s Printer. Retrieved from http://www2.edu.gov.on.ca/eng/aboriginal/OFNImplementationPlan.pdf; People for Education. (2013). First Nations, Métis, and Inuit: Overcoming gaps in provincially funded schools. People for Education: Toronto. Retrieved from http://www.peopleforeducation.ca/wp-content/uploads/2013/10/First-Nations-M%C3%A9tis-and-Inuit-Education-2013.pdf.
- Toulouse, P. (2016). What Matters in Indigenous Education: Implementing a Vision Committed to Holism, Diversity and Engagement. In Measuring What Matters, People for Education. Toronto: March, 2016. Retrieved from http://peopleforeducation.ca/measuring-what-matters/wp-content/uploads/2016/04/P4E-MWM-What-Matters-in-Indigenous-Education.pdf.
- Ibid.
- English Translation: [We would love to have resource people who come to the ceremonies and serve as mentors to our Aboriginal youth, Métis, and the general population].
- Secondary School, Durham CDSB.
- Dion, S.D., Johnston, K. and Rice, C.M. (2010). Decolonizing Our Schools: Aboriginal Education in the Toronto District School Board. Toronto.
- Ministry of Education, Ontario. (2000). Ontario Curriculum Grades 11 and 12: Native Studies. Ontario: Queen’s Printer. Retrieved from http://www.edu.gov.on.ca/eng/curriculum/secondary/nativestudies1112curr.pdf.
- Ministry of Education, Ontario. (2015). First Nations, Métis, and Inuit Education Supplement. In Education Funding Technical Paper. Ontario: Queen’s Printer. Retrieved from http://www.edu.gov.on.ca/eng/funding/1516/2015TechnicalPaperEN.pdf.
- Ibid.
- Sékaly, G.F. (2016). Grants for Students Needs changes for 2015-16 and 2016-17 [Memorandum]. P.4. Retrieved from http://www.edu.gov.on.ca/eng/funding/1617/2016B06_en.pdf.
People for Education is supported by thousands of individual donors, and the work and dedication of hundreds of volunteers. We also receive support from the Atkinson Foundation, the Counselling Foundation of Canada, the Higher Education Quality Council of Ontario, the McConnell Foundation, the R. Howard Webster Foundation, and the Ontario Ministry of Education.
Every year, principals in schools across Ontario take the time to complete our survey and share their stories with us. And every year, many volunteer researchers help us put the data we collect from schools into a context that helps us write our reports.
In particular, we thank:
Sophia Ali
Sarah Cannon
Anelia Coppes
Geoffrey Feldman
Frank Kelly
Chris Markham
Ed Reed
Diane Wagner
Alex Welsh
and, as always, Dennis
Research Director:
David Hagen Cameron
Data Analyst:
Daniel Hamlin
Policy Analyst and Research Coordinator:
Elyse Watkins
Research Assistant:
Katie Peterson
Writers:
Daniel Hamlin
Annie Kidder
Gillian Parekh
Katie Peterson
Monika Pries-Klassen
Elyse Watkins
Editors:
Annie Kidder
Jacqui Strachan
Layout:
Megan Yeadon
