The Annual Ontario School Survey Data Handbook provides a high-level overview of the quantitative data collected in the 2021-22 AOSS, compiling all the information into a series of tables, charts, and key findings.
For over 20 years, People for Education has conducted its Annual Ontario School Survey (AOSS) across Ontario’s publicly funded elementary and secondary schools. For the first time, we are publishing a data handbook to provide a high-level overview of the quantitative data collected in the most recent survey cycle. This overview is primarily comprised of data tables, accompanied by brief descriptive analyses and figures to highlight trends and key findings. It is our hope that sharing these findings will spark questions and ignite conversations across school boards, provinces/territories, Canada, and beyond about the role of public education in building a better future for all.
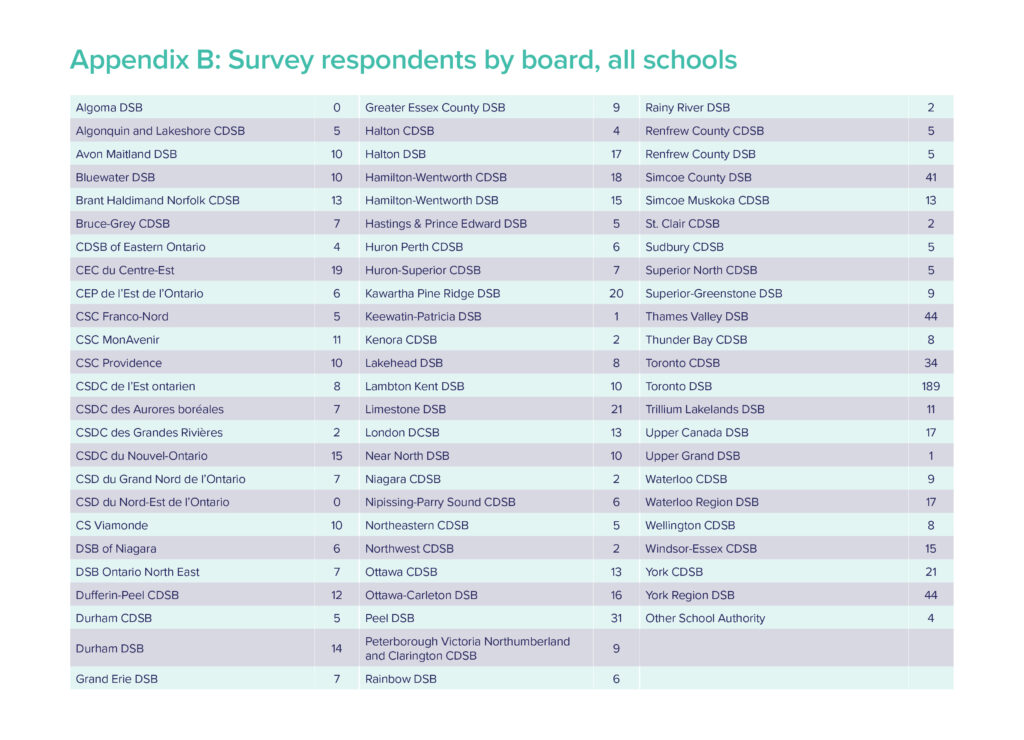
The 2021–22 AOSS is comprised of responses from 965 school principals across Ontario, representing 70 of Ontario’s 72 publicly funded school boards. The topics covered in the 2021–2022 survey cycle included school staffing, mental health and well-being of students and staff, Indigenous education, equity and anti-racism strategies, child care, and the implementation of de-streaming Grade 9 mathematics.
Key findings from the 2021–2022 Annual Ontario School Survey
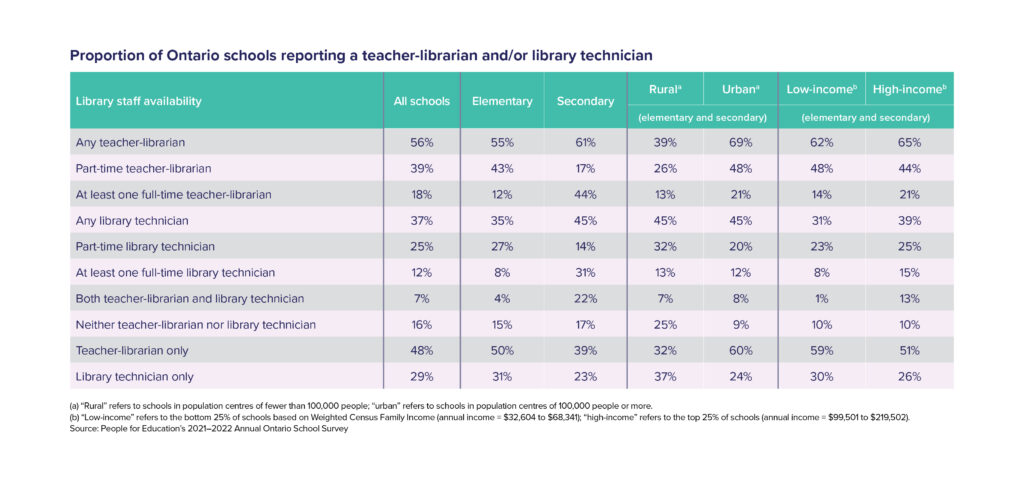
- While 56% of schools reported having a teacher-librarian, only 18% of all schools reported having at least one full-time teacher-librarian. Schools in rural areas were more likely to have neither a teacher-librarian nor a library technician.
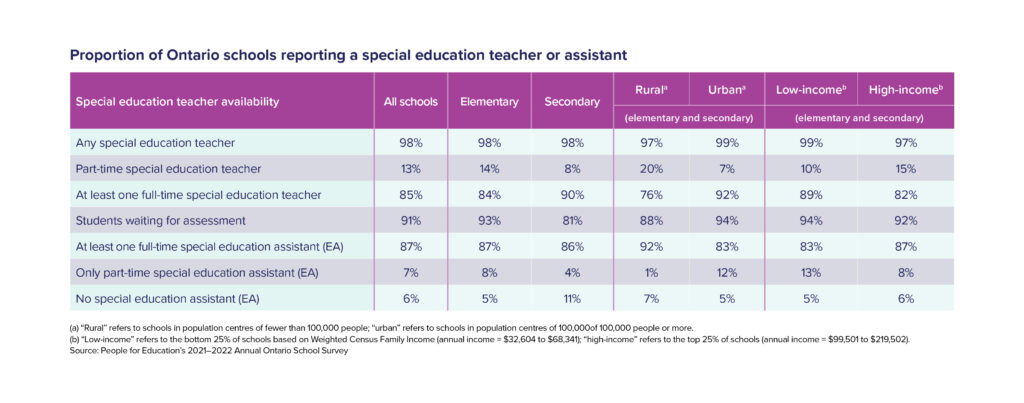
- Most schools (85%) reported having at least one full-time special education teacher. Elementary schools were more likely to report having students waiting for an assessment (93%) than secondary schools (81%).
- 1 in 4 schools reported that there was no psychologist available on a regularly scheduled basis, but the majority of schools reported that there was an option to connect virtually to a psychologist (70%) and a social worker (85%).
- Most school principals (68%) reported no nurse at their schools.
- The top five challenges faced by principals in light of COVID-19 were as follows: coordinating staff (90%), space and distancing (83%), health and safety protocols (42%), troubleshooting technology issues (41%), and staff tech knowledge (35%).
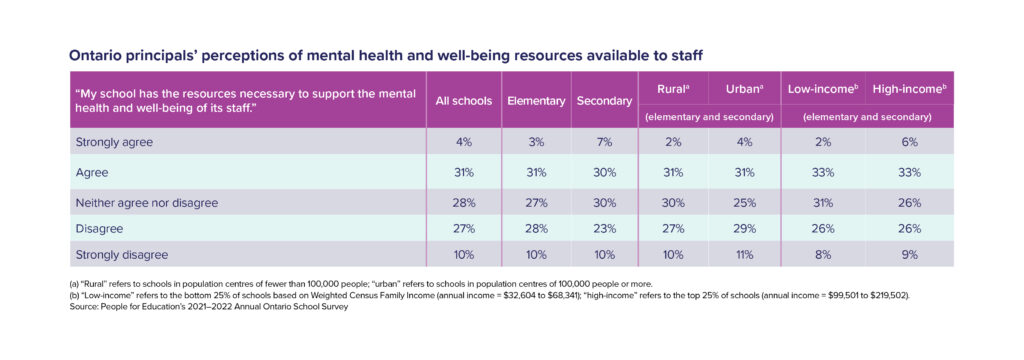
- More than half of school principals reported not having the resources necessary to support the mental health and well-being of their students and staff.
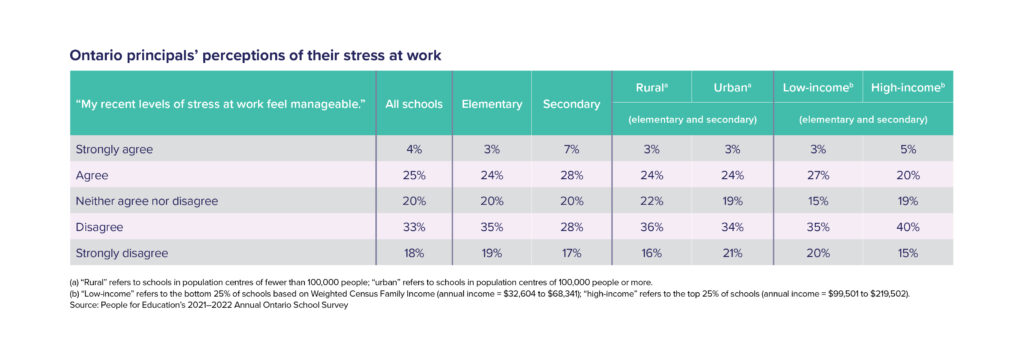
- More than half of school principals felt that their recent levels of stress at work were unmanageable.
- Two thirds of principals (64%) reported their school collected race-based student demographic data.
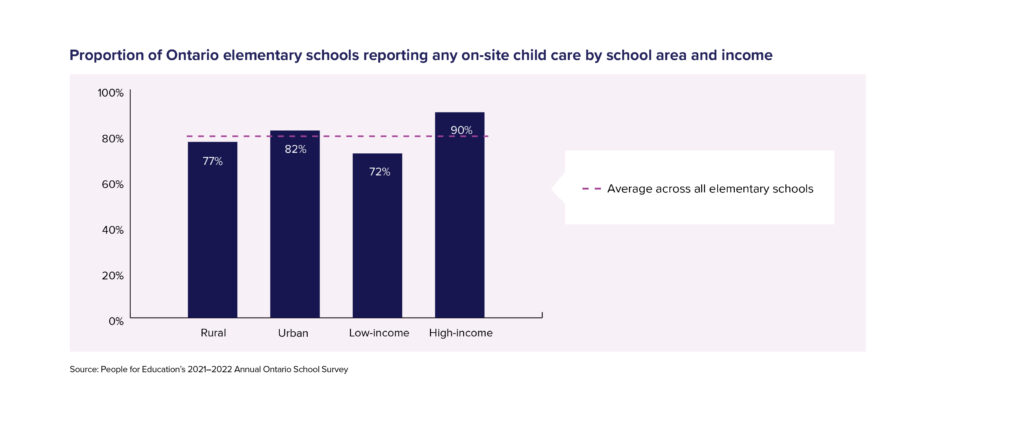
- A higher proportion of elementary schools in high-income areas reported having some form of on-site child care (90%), compared to elementary schools in low-income areas (72%). Approximately 1 in 4 elementary school principals in low-income areas (23%) reported no on-site child care for children from pre-kindergarten to Grade 6.
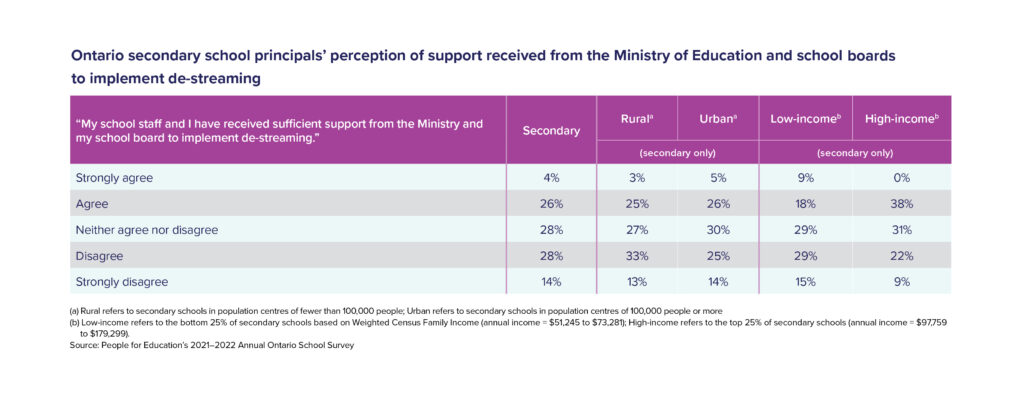
- Only 30% of secondary school principals felt that their schools received sufficient support from the Ministry and school board to implement de-streaming.
Other People for Education reports based on 2021–2022 AOSS data include:
2021-22 Annual Ontario School Survey: A perfect storm of stress
Timing is everything: The implementation of de-streaming in Ontario’s publicly funded schools
A. Introduction
Every year, People for Education (PFE) surveys Ontario’s publicly funded elementary and secondary schools. The 2021–2022 Annual Ontario School Survey (AOSS) is the 25th annual survey of elementary schools and 22nd annual survey of secondary schools in Ontario. This data handbook provides a high-level overview of the data collected in the 2021–2022 AOSS, and it marks the beginning of an annual series that will publicly report on our survey findings in an effort to ignite conversations about strengthening and transforming the public education system.
Geographic and income analyses were based on population and average median family income data from Statistics Canada and the Ontario Ministry of Education. In this handbook, “rural” refers to schools located in population centres of fewer than 100,000people and “urban” refers to schools located in population centres of 100,000 people or more. Income analysis involved sorting schools from highest to lowest income based on the weighted family income of the school’s residential postal code. In this handbook, “low-income” refers to schools sorted into the bottom 25% of average family income and “high income” refers to schools in the top 25%.[1]
- Only the bottom 25% and top 25% of schools were compared during analysis. This handbook does not report on the middle 50% of schools. Please see Appendix A: Methodology for more details.
B. Breakdown of 2021–22 AOSS respondent sample
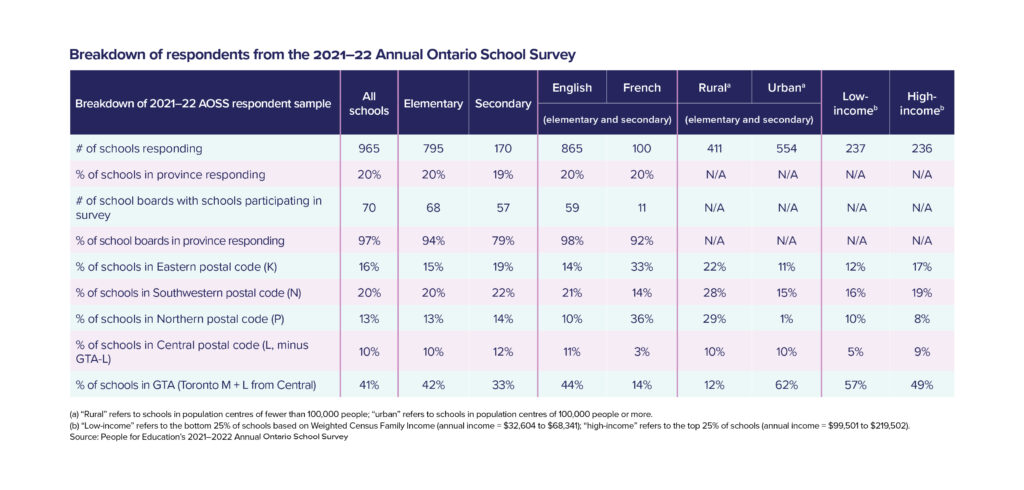
- The 2021–22 AOSS received 965 responses from principals across Ontario, representing 70 of Ontario’s 72 publicly funded school boards.
- Survey respondents represented approximately one fifth of all publicly funded schools in Ontario. This proportion is consistent across elementary, secondary, English, and French schools.
- In order from highest to lowest number, survey respondents represented schools from all Ontario regions: Greater Toronto Area (41%), Southwestern (20%), Eastern (16%), Northern (13%), and Central (10%).
Table 1
C. Staffing
C1. Vice-principals
- 58% of all schools reported having a vice-principal.
- A vice-principal was much more likely to be reported at a secondary school (91%) than an elementary school (51%).
Table 2
C2. Special education teachers
- The majority of schools (85%) reported having at least one full-time special education teacher.
- Elementary schools were more likely to report having students waiting for assessment (93%) than secondary schools (81%).
- A higher proportion of schools in urban areas (92%) reported having at least one full-time special education teacher than schools in rural areas (76%).
Table 3
C3. Library staff
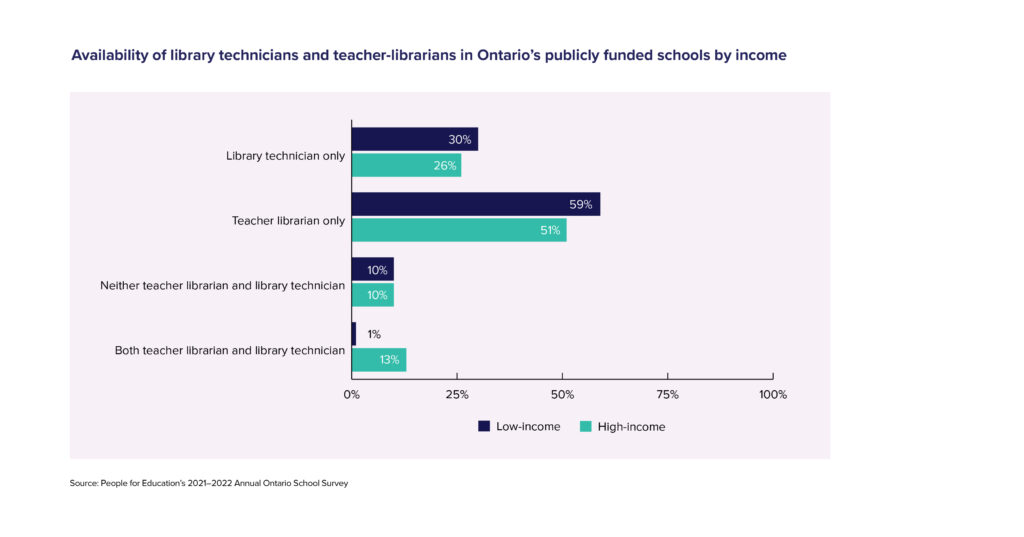
- While 56% of all schools reported having a teacher-librarian, only 18% reported having at least one full-time teacher-librarian.
- Only 37% of all schools reported having a library technician (either full-time or part-time).
- 1 in 4 schools in rural areas reported having neither a teacher-librarian nor a library technician. In contrast, 1 in 10 urban schools reported having neither a teacher-librarian nor a library technician.
Table 4
C4. Guidance teachers/counsellors
- While most elementary schools reported having less than one full-time guidance teacher/counsellor (98%), most secondary schools reported having more than one full-time guidance teacher/counsellor (73%).
Table 5
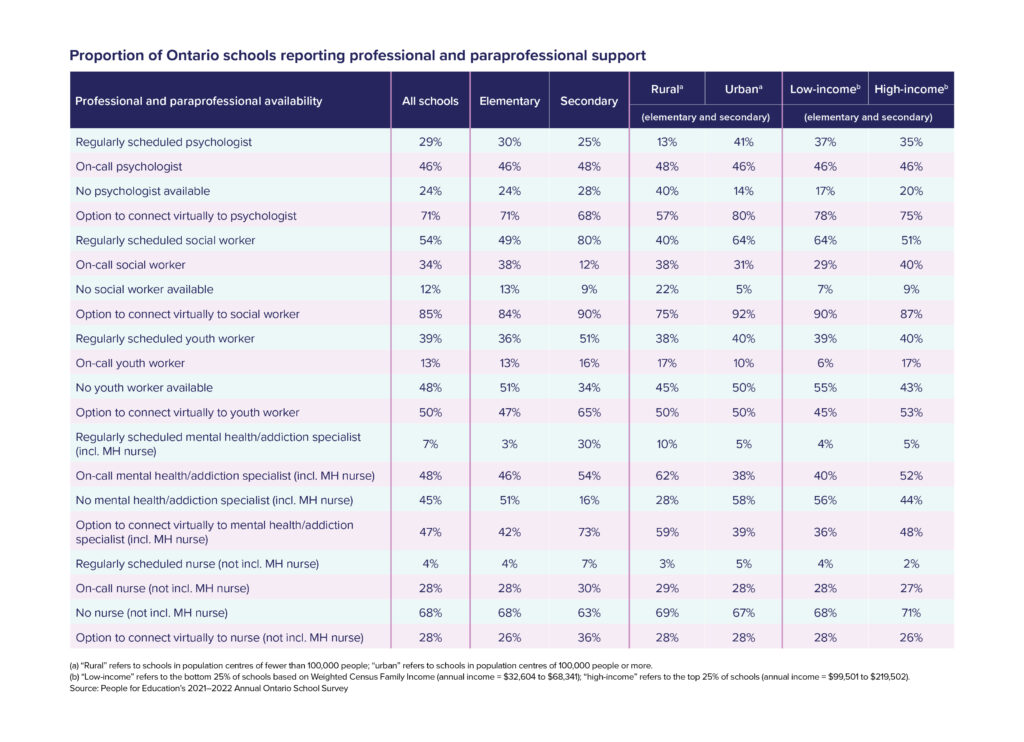
C5. Professionals and paraprofessionals
- 1 in 4 schools reported that there was no psychologist available.
- More than half of all schools (54%) reported having a regularly scheduled social worker.
- Most schools reported that there was an option to connect virtually to a psychologist (70%) and a social worker (85%).
- More secondary schools (51%) reported having a regularly scheduled youth worker than elementary schools (36%).
- A regularly scheduled mental health/addiction specialist was more commonly reported by secondary schools (30%) than elementary schools (3%).
- The majority of schools (68%) reported having no nurse.
Table 6
D. COVID- 19 response
For a detailed analysis of 2021–2022 AOSS data related to COVID-19 and its impact on schools see our report: 2021–22 Annual Ontario School Survey: A perfect storm of stress.
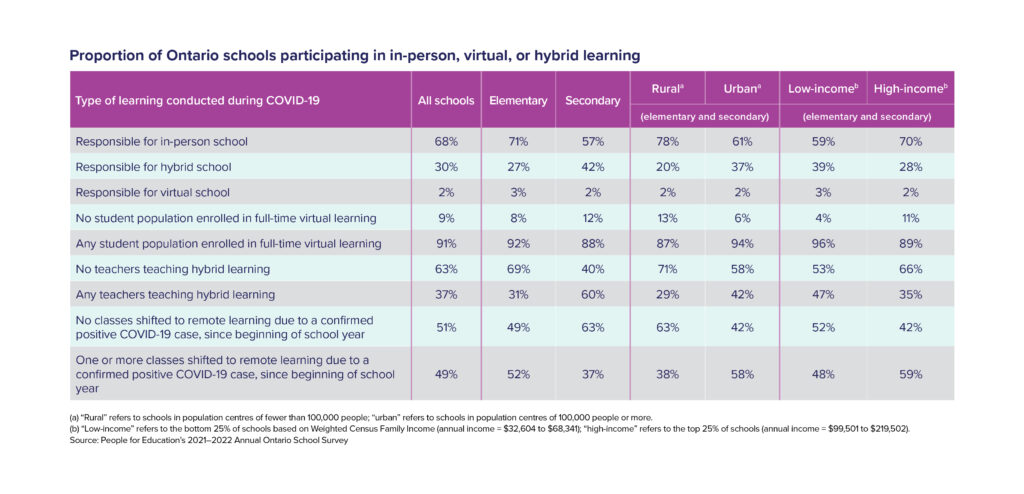
- Survey respondents were more likely to be responsible for an in-person school (68%) than a hybrid school (30%) or a virtual school (2%).
- Most schools reported that at least some of their student population enrolled in full-time virtual learning (91%).
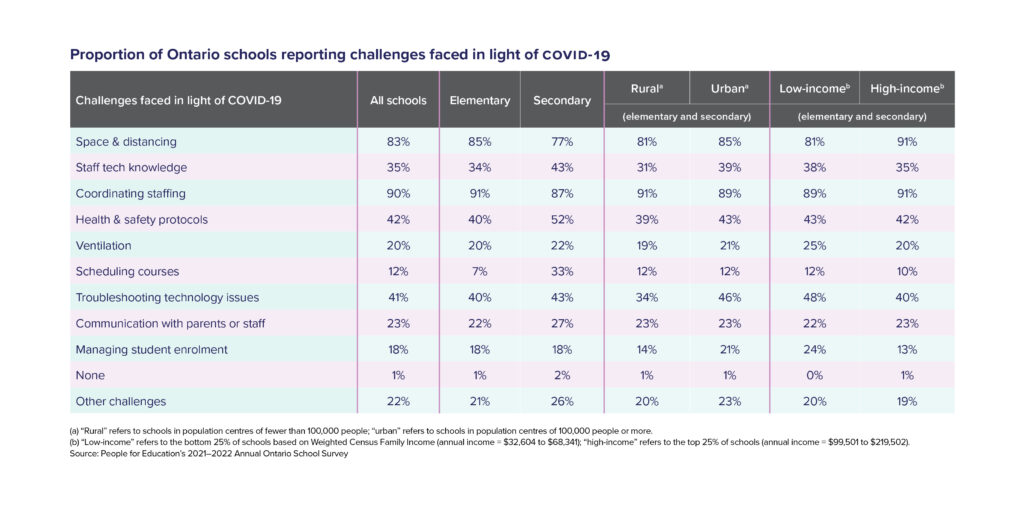
- The top five challenges faced by schools in light of COVID-19 were as follows: coordinating staff (90%), space and distancing (83%), health and safety protocol (42%), troubleshooting technology issues (41%), and staff tech knowledge (35%).
Table 7
E. Mental health and well-being
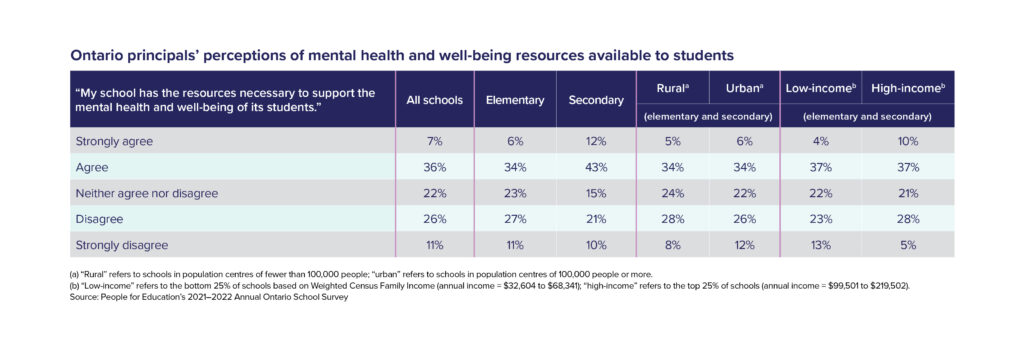
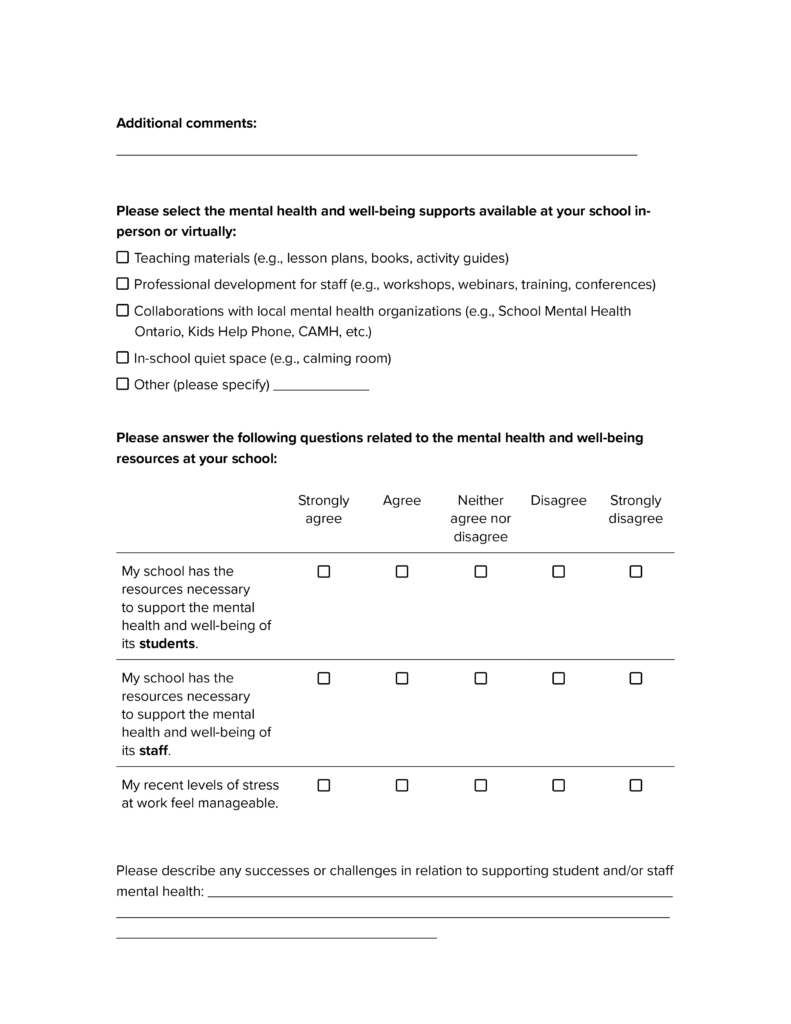
- Less than half of all school principals agreed or strongly agreed with the statement, “My school has the resources necessary to support the mental health and well-being of its students” (43%).
- Only one third of all school principals agreed or strongly agreed with the statement, “My school has the resources necessary to support the mental health and well-being of its staff” (35%).
- Only 29% of all school principals agreed or strongly agreed with the statement, “My recent levels of stress at work feel manageable,” while more than half disagreed or strongly disagreed with this statement (51%).
Table 9
F. Student leadership
- More than half of all schools reported having a student council or student leadership group (54%).
- 38% of schools reported having no student council or student leadership groups.
- Principals who responded “other” explained that their schools had student leadership activities either in development or on hold due to the pandemic.
Table 12
G. Indigenous education
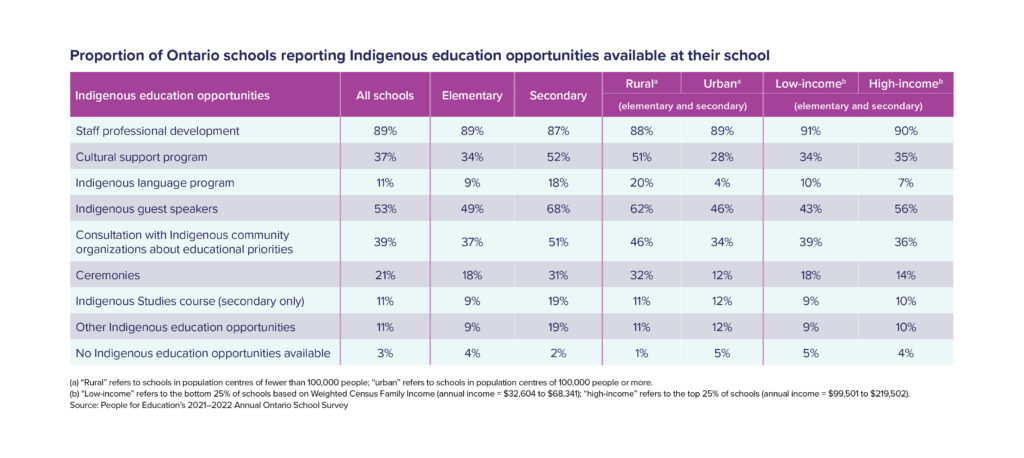
- The majority of schools reported the availability of professional development on Indigenous education (89%).
- Just over half of all schools reported having Indigenous guest speakers (53%).
- Only 37% of all schools reported having cultural support programs.
- Two thirds of secondary schools (66%) reported offering an Indigenous Studies course at their school.
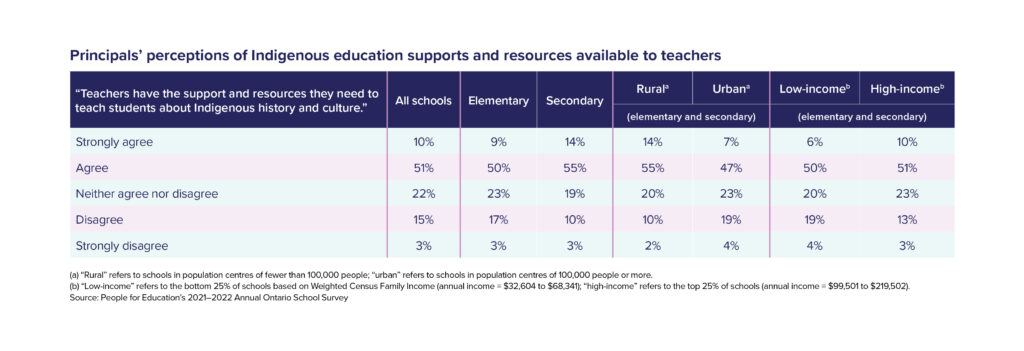
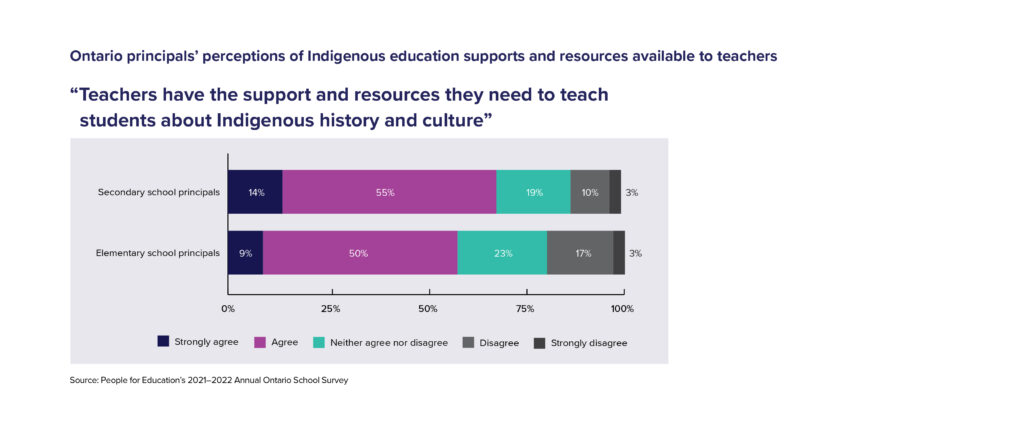
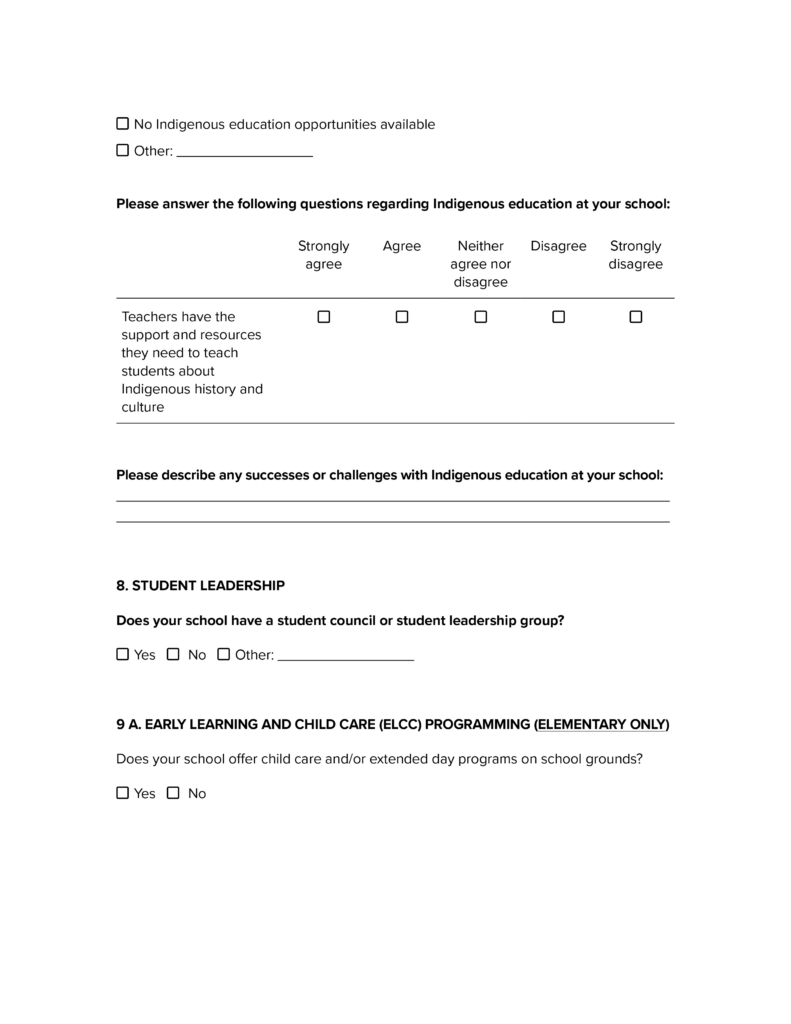
- Three in five school principals strongly agreed or agreed with the statement, “Teachers have the support and resources they need to teach students about Indigenous history and culture” (61%).
Table 13
“Teachers have the support and resources they need to teach students about Indigenous history and culture”
H. Equity and anti-racism
- Two thirds of respondents (64%) reported that their school was collecting race-based demographic data on students. Almost one third(29%) were not sure whether their school was collecting race-based demographic data.
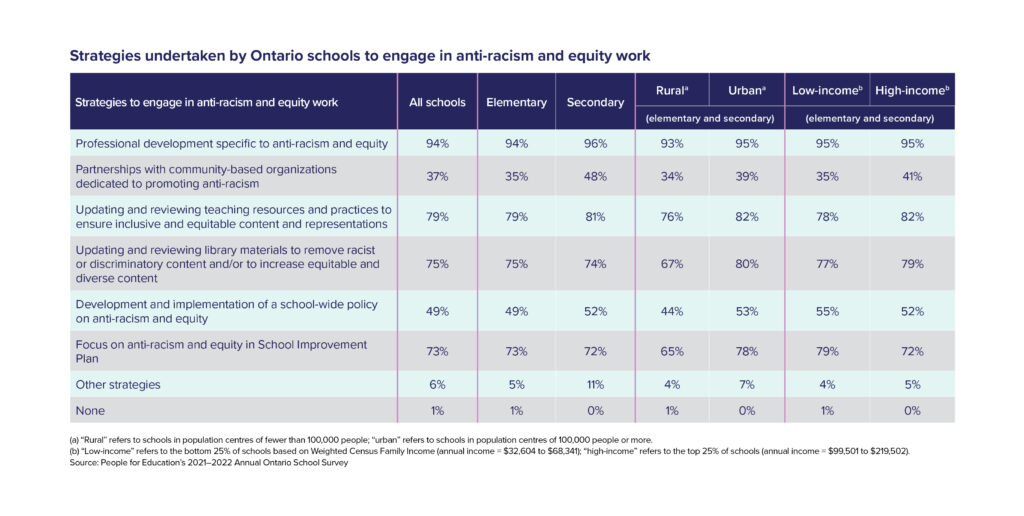
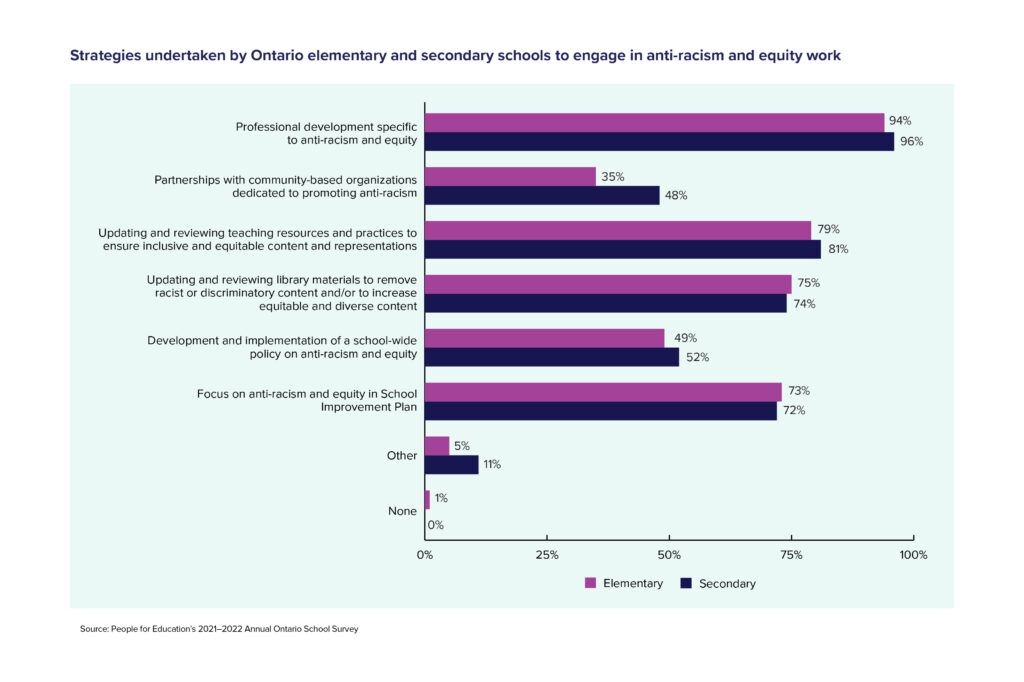
- The majority of respondents (94%) reported that professional development specific to anti-racism and equity was a strategy used by their school to engage in anti-racism and equity work.
- Only 37% of schools reported working in partnerships with community-based organizations dedicated to promoting anti-racism.
Table 15
I. On-site child care in elementary schools
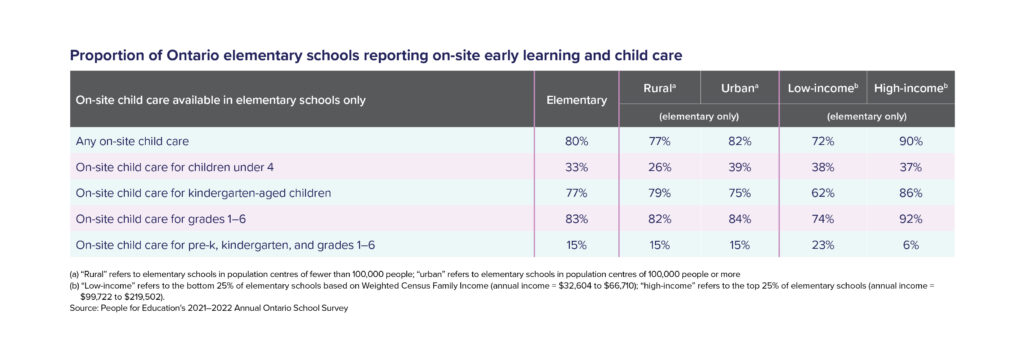
- A higher proportion of elementary schools in high-income areas reported having some form of on-site child care (90%) compared to elementary schools in low-income areas (72%).
- Approximately 1 in 4 elementary schools in low-income areas (23%) reported no on-site child care for children from pre-kindergarten to Grade 6.
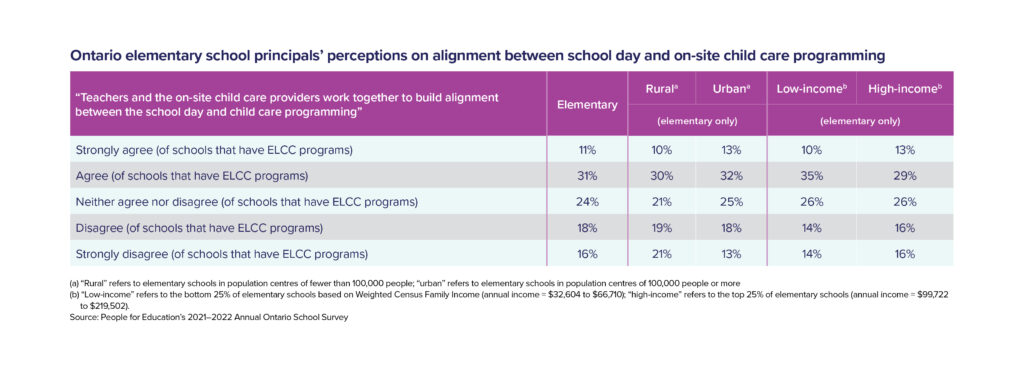
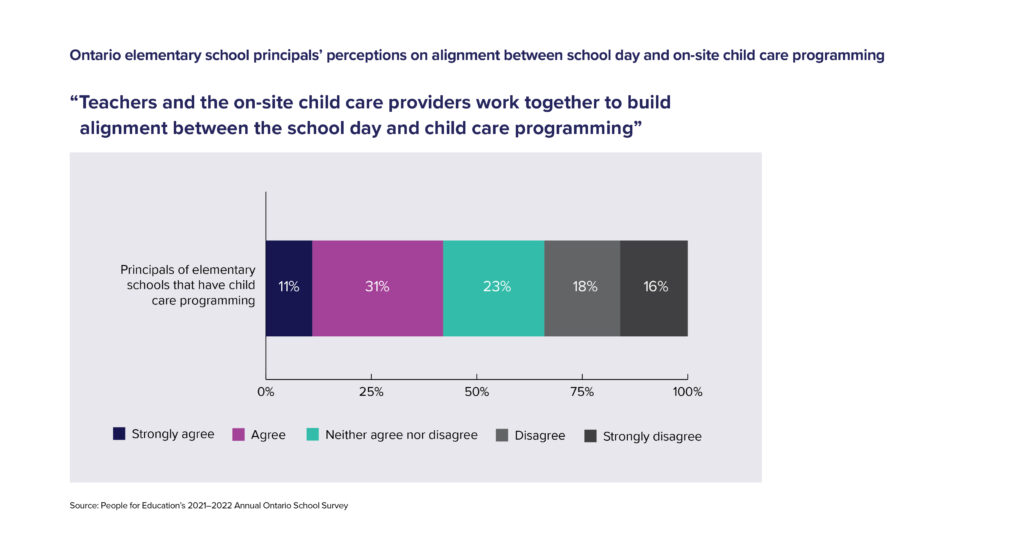
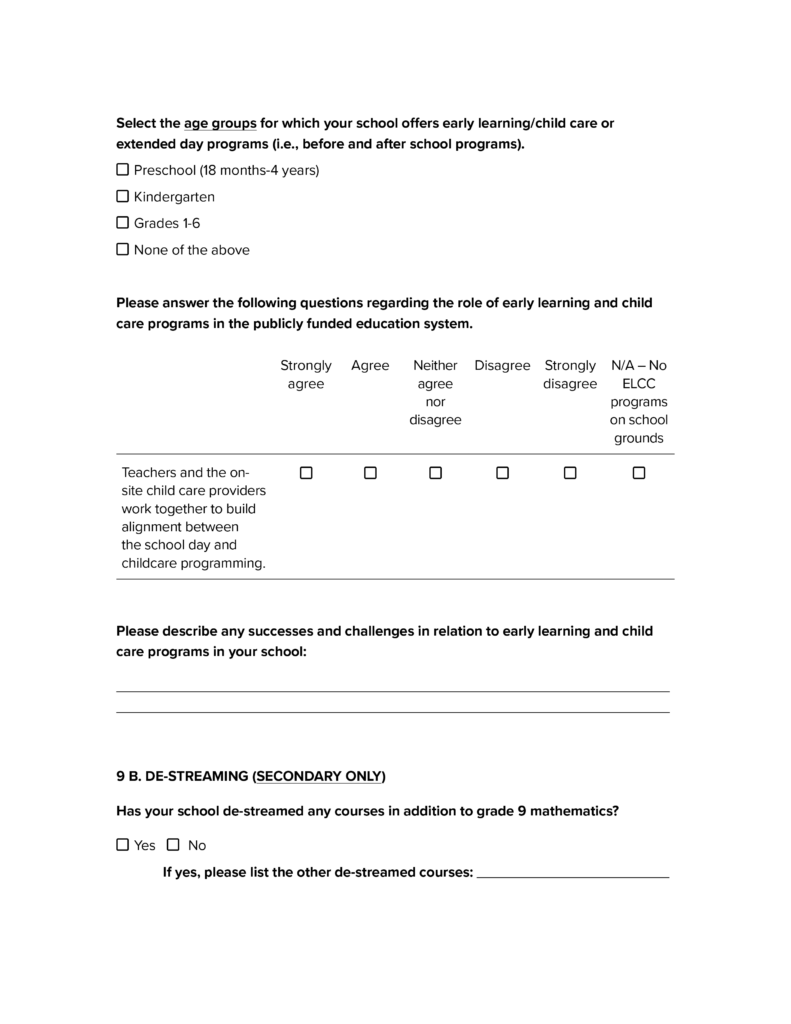
- Of all elementary schools that have child care programming in their schools, less than half (42%) strongly agreed or agreed with the statement, “Teachers and the on-site child care providers work together to build alignment between the school day and child care programming.”
- One third of elementary schools (34%) that have child care programming disagreed or strongly disagreed with the above statement.
Table 17
“Teachers and the on-site child care providers work together to build alignment between the school day and child care programming”
J. Implementation of de-streaming Grade 9 mathematics
For a detailed analysis of 2021–2022 AOSS data related to the implementation of de-streaming in Ontario schools, please see our report: Timing is everything: The implementation of de-streaming in Ontario’s publicly funded schools.
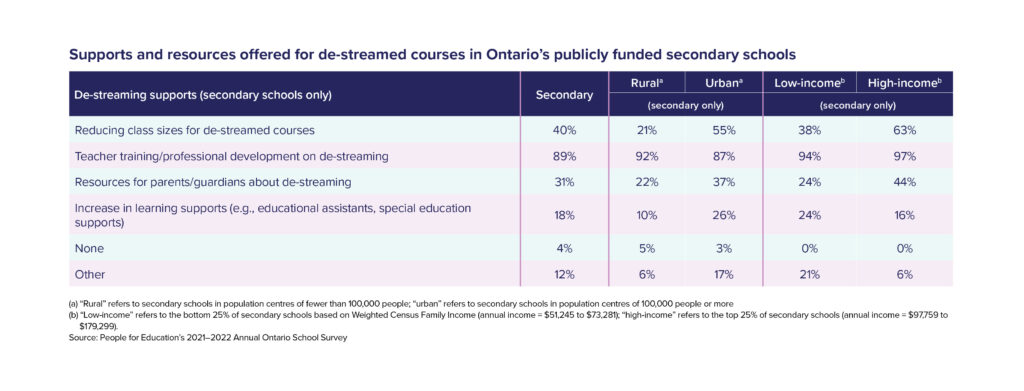
- 18% of secondary schools reported increased learning supports (e.g. educational assistants, special education supports) for de-streamed courses.
- Secondary schools in high-income areas were more likely to report reduced class sizes for de-streamed courses (63%) compared to secondary schools in low-income areas (38%).
- Only 30% of secondary school principals strongly agreed or agreed with the statement, “My school staff and I have received sufficient support from the Ministry and my school board to implement de-streaming.” In contrast, 42% of secondary school principals disagreed or strongly disagreed with this statement.
- Approximately one third of secondary schools (35%) reported de-streaming other courses in addition to Grade 9 mathematics.
Table 19
Appendix A: Methodology
This report is based on data from the 965 schools that participated in the Annual Ontario School Survey 2021–22. Longitudinal data comparisons are based on the data collected from the elementary and secondary schools that participated in PFE’s AOSS 2019–20 and 2020–21. Unless cited from other sources, the statistics and quoted material in this report originate from PFE’s AOSS, the 25thannual survey of elementary schools, and the 22ndannual survey of secondary schools in Ontario. Surveys from 2021–22 AOSS were completed online via SurveyMonkey in both English and French between October 19, 2021, and January 17, 2022.
Survey responses were disaggregated to examine survey representation across provincial regions (see Table 23). Schools were sorted into geographical regions based on the first letter of their postal code. The GTA region includes schools with M postal codes as well as those with L postal codes located in GTA municipalities (City of Toronto n.d.). Regional representation in this year’s survey corresponds relatively well with the regional distribution of Ontario’s publicly funded schools.
Table 23

In order to analyze a school’s geographical circumstances, each school’s postal code was used to identify the population of the town or city in which the school is located, based on 2021 Census data. Statistics Canada uses population size to classify a population centre as small, medium, or large urban. The population breakdown is as follows: small population centres have a population between 1,000 and 29,999,medium population centres have a population between 30,000 and 99,999, and large urban population centres have a population of 100,000 or more (Statistics Canada 2021). While Statistics Canada has various definitions of a rural area, for the purposes of this analysis, a rural area has a population under 1,000. In order to conduct data analysis with an adequate sample size, schools in rural, small, and medium areas (all schools: n= 411; elementary schools only: n= 337; secondary schools only: n= 83) were compared against schools in large urban areas (all schools: n= 554; elementary schools only: n= 458; secondary schools only: n= 101), unless otherwise specified. Therefore, in this report, “rural” refers to schools that are located in population centres of fewer than 100,000 people, whereas “urban” refers to schools located in population centres of 100,000 people or more.
During analysis, data collected from the survey were matched with the Weighted Average Median Census Family Income by School, 2017–2018, which was provided to PFE through a Request for Information from the Ontario Ministry of Education’s Education Statistics and Analysis Branch. The Median Census Family Income information was derived from the 2016 census for all the dissemination areas associated with a school based on its students’ weighted enrolment by residential postal code. Schools were then sorted from highest to lowest income based on this measure. In this report, the top 25% of schools based on Weighted Census Family Income are considered “high-income” (all schools: n= 236, average income = $116,664; elementary schools only: n = 195, average income = $117,305; secondary schools only: n= 44, average income = $112,492) and the bottom 25% are considered “low-income” (all schools: n = 237, average income = $57,851; elementary schools only: n= 196, average income = $56,718; secondary schools only: n= 44, average income = $64,596), unless otherwise specified.
Qualitative data analysis was conducted using inductive analysis. Researchers read responses and coded emergent themes in each set of data (i.e. the responses to each of the survey’s open-ended questions). The quantitative analyses in this report are based on descriptive statistics. The primary objective of the descriptive analyses is to present numerical information in a format that is accessible to a broad public readership. All data were analyzed using SPSS statistical software. All calculations have been rounded to the nearest whole number and may not total 100% in displays of disaggregated categories. All survey responses and data are kept confidential and stored in conjunction with Tri-Council recommendations for the safeguarding of data.
For questions about the methodology used in this report, please contact the research team at PFE: [email protected].
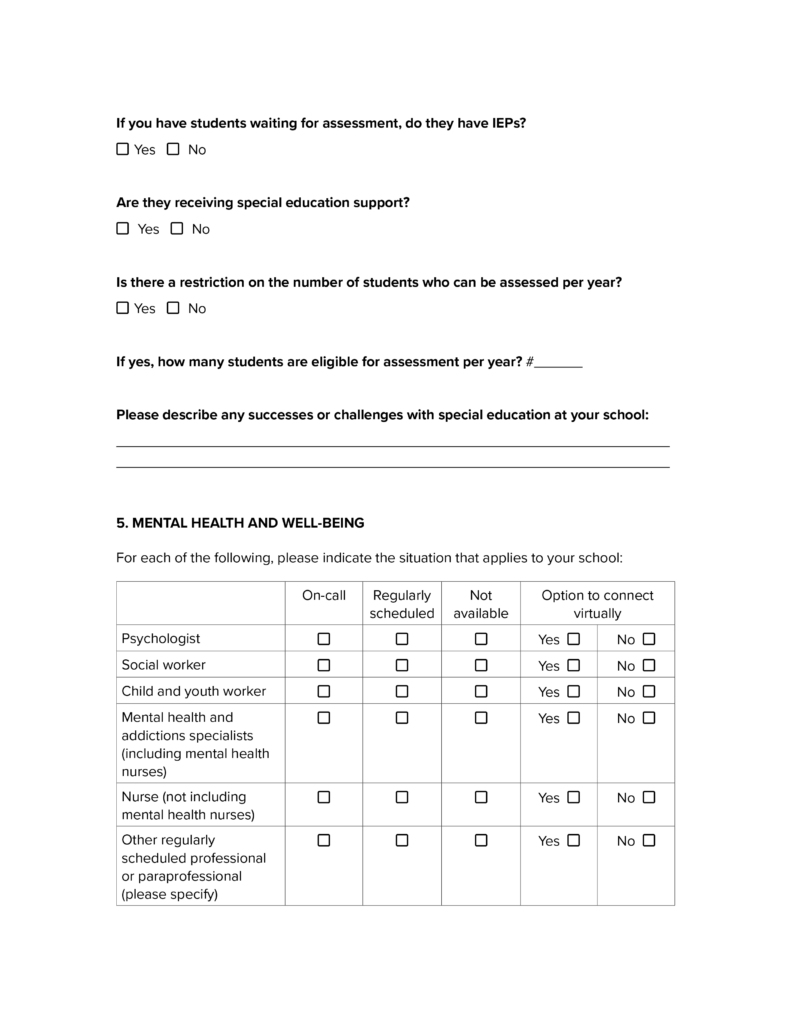
Appendix C: 2021 / 2022 Annual Ontario School Survey
Page 1

Page 2

Page 3

Page 4
Page 5
Page 6

Page 7
Page 8
Page 9

Page 10
Page 11

List of tables and figures
- Table 1: Breakdown of respondents from the 2021–22 Annual Ontario School Survey
- Table 2: Proportion of Ontario schools reporting a vice-principal
- Table 3: Proportion of Ontario schools reporting a special education teacher or assistant
- Table 4: Proportion of Ontario schools reporting a teacher-librarian and/or library technician
- Table 5: Proportion of Ontario schools reporting a guidance teacher/counsellor
- Table 6: Proportion of Ontario schools reporting professional and paraprofessional support
- Table 7: Proportion of Ontario schools participating in in-person, virtual, or hybrid learning
- Table 8: Proportion of Ontario schools reporting challenges faced in light of COVID-19
- Table 9: Ontario principals’ perceptions of mental health and well-being resources available to students
- Table 10: Ontario principals’ perceptions of mental health and well-being resources available to staff
- Table 11: Ontario principals’ perceptions of their stress at work
- Table 12: Proportion of Ontario schools reporting student leadership activities
- Table 13: Proportion of Ontario schools reporting Indigenous education opportunities available at their school
- Table 14: Principals’ perceptions of Indigenous education supports and resources available to teachers
- Table 15: Proportion of Ontario schools reporting collection of race-based student demographic data
- Table 16: Strategies undertaken by Ontario schools to engage in anti-racism and equity work
- Table 17: Proportion of Ontario elementary schools reporting on-site early learning and child care
- Table 18: Ontario elementary school principals’ perceptions on alignment between school day and on-site child care programming
- Table 19: Supports and resources offered for de-streamed courses in Ontario’s publicly funded secondary schools
- Table 20: Ontario secondary school principals’ perception of support received from the Ministry of Education and schoolboards to implement de-streaming
- Table 21: Proportion of Ontario schools reporting de-streaming any courses in addition to Grade 9 mathematics
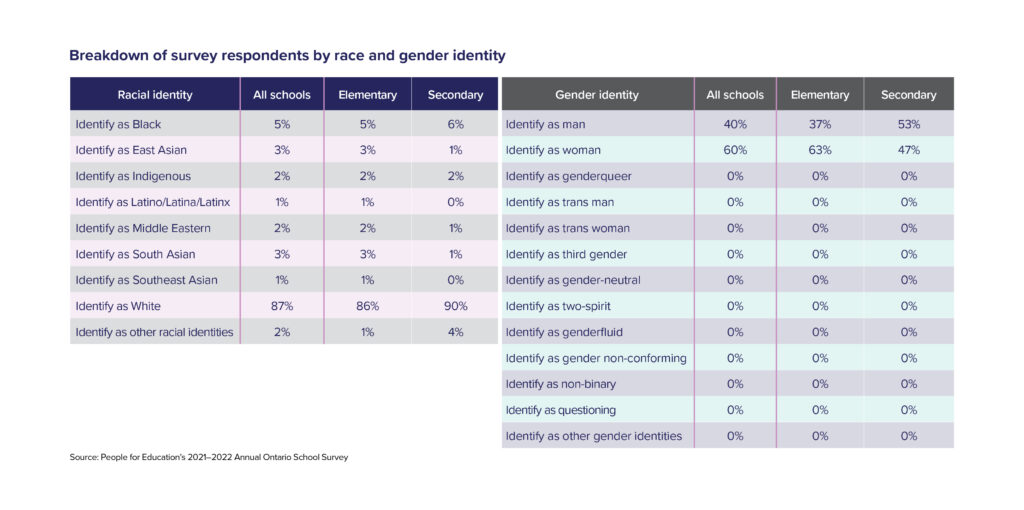
- Table 22: Breakdown of survey respondents by race and gender identity
- Table 23: Survey response representation by region, all schools
- Figure 1: Availability of library technicians and teacher-librarians in Ontario’s publicly funded schools by income
- Figure 2: Ontario principals’ perceptions of Indigenous education supports and resources available to teachers
- Figure 3: Strategies undertaken by Ontario elementary and secondary schools to engage in anti-racism and equity work
- Figure 4: Proportion of Ontario elementary schools reporting any on-site child care by school area and income
- Figure 5: Ontario elementary school principals’ perceptions on alignment between school day and on-site child care programming
References
City of Toronto. n.d. “City Halls – GTA Municipalities and Municipalities Outside of the GTA.” Accessed February 28, 2022. https://www.toronto.ca/home/311-toronto-at-your-service/find-service-information/article/?kb=kA06g000001cvbdCAA.
Statistics Canada. 2021. “Dictionary, Census of Population, 2021 – Population centre (POPCTR).” Updated on February 9, 2022. https://www12.statcan.gc.ca/census-recensement/2021/ref/dict/az/Definition-eng.cfm?ID=geo049a.

