
Our public education systems generate and rely on a wide range of information. Yet Canada's data infrastructure remains fragmented and uneven.
Canada stands out internationally as one of the few countries without national coordination or oversight of public education. Under the Constitution, responsibility for kindergarten to grade 12 schooling rests entirely with the 13 provinces and territories—a structure that creates both opportunities and challenges for coherent policy, equitable outcomes, and consistent reporting.
This decentralization also poses significant challenges for education data collection and sharing. Our public education systems generate and rely on a wide range of information, from surveys and administrative records to large-scale assessments and linked datasets. Yet unlike countries with national standards for education data, Canada’s data infrastructure remains fragmented and uneven. As a result, valuable datasets are often incomplete, difficult to compare across jurisdictions, or inaccessible to policymakers, researchers, and the public. People for Education, working with partners at the Centre for Leading Research in Education (CLRiE) at Laurier University, undertook a scan of available data across the country to map the landscape of education-related data in Canada, identifying what exists, where it is housed, and where the gaps are most pressing. It reveals a mixed picture: strong examples of collaboration and innovation sit alongside significant challenges that limit the country’s ability to evaluate interventions, track the impact of policy changes and innovations, monitor equity, measure outcomes, and make evidence-informed decisions.
Among the most significant challenges is the uneven collection and publication of key information. For example, while some provinces gather race-based or Indigenous identity data, most do not, making it difficult to understand how opportunities and outcomes are distributed across populations. Even when data are collected, they are often not publicly accessible, not timely, or not comparable across provinces and territories. In many cases, privacy concerns—though important—restrict access even to non-sensitive information such as staffing levels. The result is that many questions critical to equity, accountability, and system improvement remain unanswered.
Our scan also highlights missed opportunities to link education data with other sectors such as health, income, or post-secondary education including apprenticeships. These kinds of linkages are essential to understanding long-term outcomes, assessing the broader social and economic impacts of schooling, and supporting policies that address education as a determinant of health and well-being. Without such connections, Canada lags behind peer countries that have built robust data infrastructures to inform policy and track progress. At the same time, there are notable strengths to build on. The Pan-Canadian Education Indicators Program (PCEIP) provides a valuable set of comparable statistics across all provinces and territories, and national surveys and assessments administered by Statistics Canada and international partners offer important insights into student experiences and achievement. Provinces such as British Columbia and Manitoba have also taken innovative steps toward more accessible and linked datasets.
Taken together, the findings of this scan point to a central conclusion: Canada’s education data landscape has some rich pockets, but the data are often disconnected and the data is incomplete. To fully realize the potential of public education as a driver of equity, health, and prosperity, Canada requires a more coherent and coordinated approach to collecting, publishing, and linking education data. A stronger data infrastructure would not only support evidence-based policymaking and public accountability, it would also allow Canada to meet its international commitments and learn more effectively from its own systems, rather than relying heavily on research from other contexts.
The need for a wide range of education-related data is not always recognized as a policy priority. By definition, large-scale data can be reductionist, and many datasets are far from perfect. Valid concerns are also often raised about how the misuse of data can reflect or reinforce stereotypes, and that publication of data can lead to unfair rankings that don’t reflect real-world challenges.
Despite these limitations, data can and should play a vital role in policy development, accountability, and effective systems change. Policymakers, system leaders, educators, parents, and the public must be able to understand how our public education systems are functioning, and data-based indicators—if we have the right ones—can help serve this need.
Data is vital for providing objective, evidence-based information about the health and strength of education systems and for tracking how systems are progressing towards their stated goals (for example, in the areas of equity or improving graduating rates). Transparency and evidence are prerequisites for accountability and informed decision-making, as well as a key tool to enable and monitor improvement efforts. Education is a human-centric process, which makes both measurement and large-scale change inevitably complex. Given the importance and challenges of educating today’s children and youth for tomorrow, key policy levers related to data are critically important.
To date, many insights about the impact of educational practices that inform Canadian policy decisions come from studies conducted in other countries, such as Australia, the UK and the US. In these countries, there are national data collection standards that ensure that the same type of data (e.g., student demographics, absenteeism, teacher credentials) are collected, stored and aggregated. These data are also publicly available at a national level through data dashboards and downloadable microdata files that allow policymakers, researchers, and the general public to see how school resources are distributed, and outcomes are experienced. For example, searchable websites in Australia and England provide rich contextual data at the school level (even if test scores sometimes obscure other information).
In particular, policy decisions about education in Canadian provinces and territories are often informed by research conducted in the United States, despite our significant differences in context. Canada has an opportunity to attend to the data needs that we have within our borders without relying on external research to fill in the gaps.
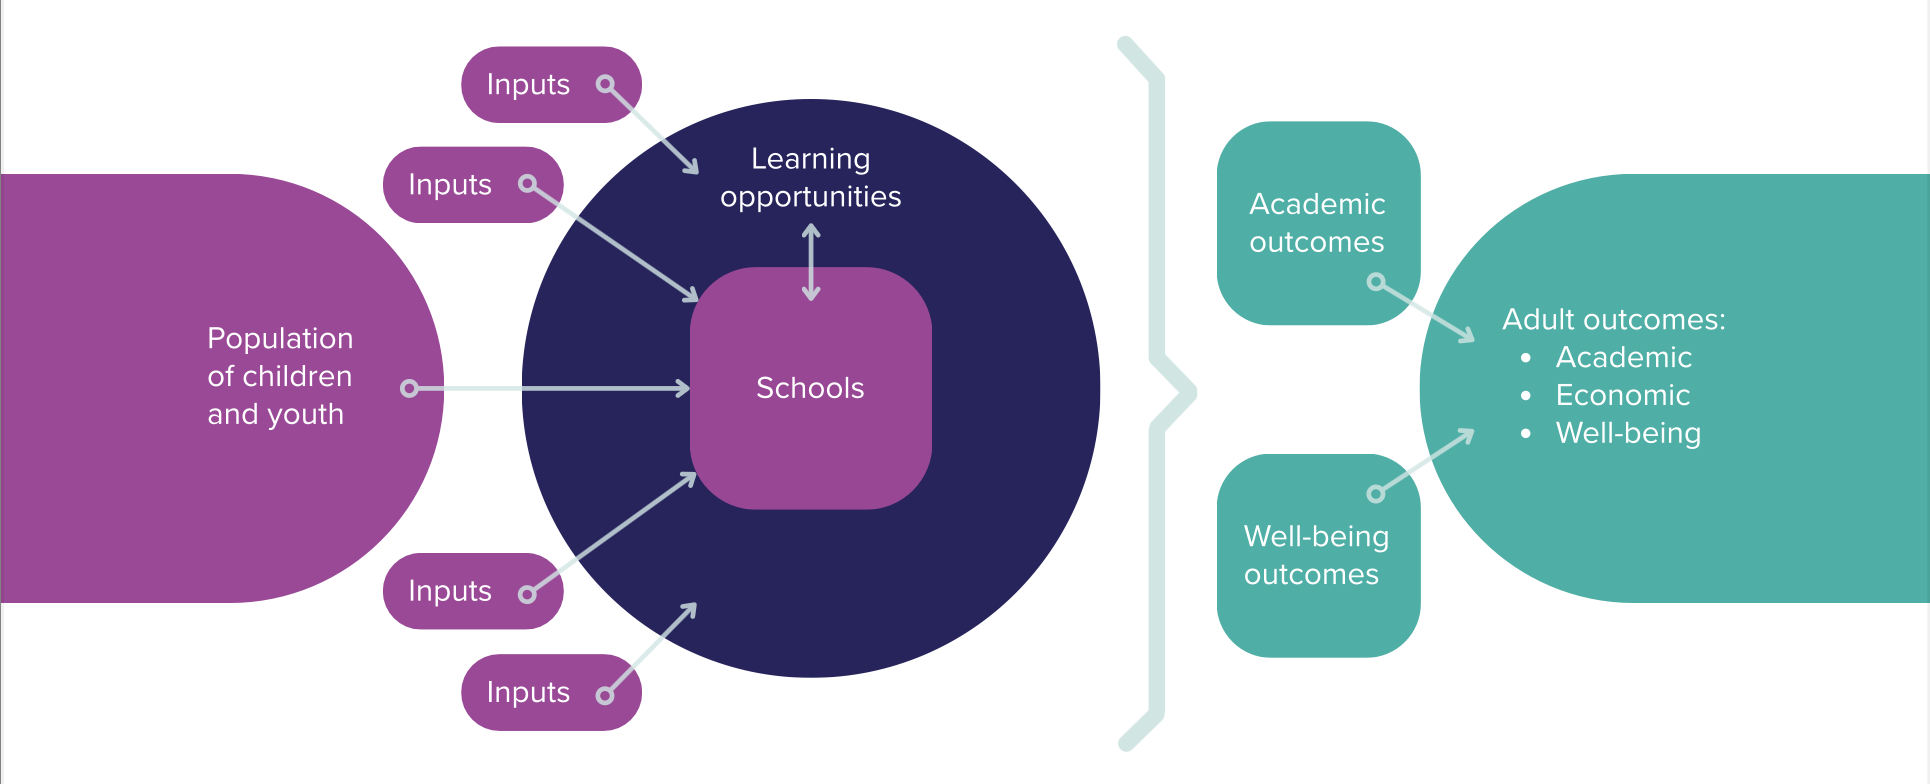
The type of data needed depends on the questions stakeholders hope to have answered.
However, if we take a step back and think about how students move through schools, we can start to picture what types of data we might need to have.
First, we would want to learn about who the students are that are entering our schools through student demographic information (e.g., family income, race, gender identity, disability).
Once students enter school, it is important to understand the characteristics of students’ learning environments (e.g., qualifications of teaching staff, disciplinary climate, or supports for students with disabilities and/or mental health needs).
Next, you would want to understand students’ outcomes along multiple dimensions (e.g., absenteeism, well-being, standardized test performance, and educational attainment including graduation and post-secondary access).
Finally, you would want to understand connections between immediate outcomes and longer-term life outcomes. Together, these data would allow for large-scale analysis that could help drive system improvements and target resources where they are most needed.
Types of data
There are multiple policies and practices that, together, restrict what policymakers,
researchers and the public can learn about the health and strength of public education across the country. These challenges have been well-documented (for example by Gallagher-Mackay in this 2017 report and Robson in this 2021 essay), but the following is a summary of some of the most pressing challenges.
Data are not always collected.
While some provinces collect some race-based data, including data from Indigenous self-identification surveys, the majority do not, which makes it difficult to know how educational opportunities and outcomes are distributed among populations.
Data are not always published.
When data are collected, they are often kept at either the board / district or provincial level and not shared publicly. This is due to both resource constraints and privacy concerns or legislative limits. Privacy concerns are not unwarranted, but much education data is not sensitive in nature or when aggregated. For example, staffing levels for each school are not regularly published even though many provinces and territories publish other school-level data such as test scores.
Data is not always timely.
When data are published, there is often significant lag between data collection and publication. Delays in data mean many important decisions are made in the dark. For example, during COVID-19, there was an 18-month to 2-year delay between school closures and measures of educational impact in Canada, while the US, the UK and many other countries were able to report within two or three months.
Data are not always comparable.
There are many types of data—called administrative data—that are collected in the process of running day-to-day school operations. For instance, all schools keep track of student attendance. However, because each province and territory defines these data differently it is impossible to compare across systems.
Data are not always linked.
We will dig more into linked datasets below, but in general, linked datasets allow policymakers and researchers to explore more complex policy questions and track long-term outcomes. Linkages that are important for research and policy development purposes include:
- Linking K-12 data with demographic, geographic, or other contextual data that would provide the opportunity for disaggregated analysis, permitting a deeper understanding and more effective policy development focused on equity and human rights;
- Linking data on inputs of K-12 education systems (e.g., availability and type of special education supports, guidance counselors or access to enriched courses) with outcomes (e.g., graduation, grades, test scores), allowing researchers to test hypotheses about what’s working, under what conditions and allowing policy makers to develop evidence-informed policy;
- Linking K-12 data with data about other levels of education and the labour force (e.g., information about early childhood education or post-secondary education), supporting an understanding of access and economic benefits of education across the continuum; or
- Linking K-12 data with data from other related sectors, (e.g., connecting education and health datasets would support the study of education as a social determinant of health or provide data to help contribute to policies to support healthy schools).
There is no centralized education data repository.
Although “open data” initiatives in some provinces have helped, a final—though not insignificant—complication is that it is often unclear what data have been collected by governments, universities or private organizations.
Not just an education problem
Canadian data infrastructure challenges are not limited to the education sector. There have been extensive criticisms that a lack of data limits our ability to understand our society and inhibits public accountability.
Experts and reporters warned during the pandemic that data gaps were both limiting systems’ capacity to address a seemingly growing mental health crisis among children and obscuring the relationship between race and health outcomes.
At an international level, Canada was criticized by the UN in 2022 for having no national data—and in particular, no identity-based data—to measure its progress in implementing the Convention of the Rights of the Child. It is also impossible to measure Canada’s progress on implementing the educational components of the Paris Agreement on climate change and the Sustainable Development Goals.
While recognizing that Canada has 13 distinct and separate jurisdictions with oversight over children and youth, the UN still emphasized that data collection should be standardized at a national level as it is in many other federal systems, to allow for comprehensive monitoring and reporting.
UNCommittee on the Rights of the Child 2022
11. While noting the existence of 13 unique data regimes, using different techniques, definitions and technologies, making aggregation and comparison of data difficult, and recalling its general comment No. 5 (2003) on general measures of implementation of the Convention, the Committee recommends that the State party:
- Improve its data collection system at the federal level in order to allow nationwide comprehensive monitoring of the rights of children and ensure that such data covers all areas of the Convention and the Optional Protocols thereto, with data disaggregated by age, sex, disability, geographical location, ethnic and national origin and socioeconomic background, in order to facilitate analysis of the situation of children, in particular those in situations of vulnerability;
- Ensure that data and indicators on children’s rights cover all children under 18 years of age and are shared among the ministries concerned and used for the formulation, monitoring and evaluation of policies, programmes and projects for the effective implementation of the Convention;
- Take into account the conceptual and methodological framework set out in the guidelines of the Office of the United Nations High Commissioner for Human Rights, entitled Human rights indicators: a guide to measurement and implementation, when defining, collecting and disseminating statistical information.
To find datasets, we searched federal, provincial and territorial government websites and open data catalogues, as well as websites of organizations that conduct research about public education and child and youth outcomes.
“Data” includes survey results (with responses provided by parents, students, or staff), administrative data (data that is collected by jurisdictions for organizational purposes, e.g., enrolment counts, courses taken, attendance, or discipline), or student outcome data (e.g., scores on standardized assessments, or data on graduation or post-secondary access).
To be included in the scan, the data must refer to school-aged children, must have at least some connections to schools or public education, and must have been collected in Canada.
We did not include one-off surveys or single point-in-time datasets, nor did we capture the varied and in-depth research studies conducted by academic researchers around the country. Finally, because of resource constraints, this data scan includes only some references to research conducted and data published by school boards. This presents a significant gap, because in Canada school boards hold some of the most detailed and crucial data on schools and students. However, the data held by school boards (and sometimes schools themselves) are not always easy to aggregate.
Not all data are created equal.
Before diving into the types of data found, it is important to clarify what “published data” can look like. There are multiple models of data sharing that range from static, summary statistics to downloadable public-access microdata files. Below is a quick outline of the different data publishing models that were encountered in our scan.
Static reports or tables.
Institutions can publish aggregated statistics or static reports summarizing data (e.g., PEI’s provincial assessment results). In these cases, the data cannot be further disaggregated, but sometimes institutions will provide statistics for sub-populations (e.g., Nova Scotia’s report on African Nova Scotian learners, or Yukon’s First Nations report). Unless accompanied by another type of data (from the list below), the user will only have access to the analyses conducted by the institution.
Interactive tables or dashboards.
Some institutions provide interactive data dashboards or searchable databases of information about schools and (e.g., British Columbia, Manitoba, Ontario, Québec, many StatCan datasets and the OECD’s PISA). These can be queried for different types of disaggregated data, albeit only to the extent that has been programmed by the publisher. For example, in Québec’s Tableau de bord de l’éducation, users can search for enrolment information by school, but can only view staffing information by district.
Publicly available microdata.
Institutions can publish their complete datasets, stripped from any confidential information. Typically, microdata files provide school-level information across multiple domains, such as (in the case of Newfoundland and Labrador’s enrolment data) enrolment count by grade, principal contact information, rural vs. urban classification, and the school’s address with postal code. Ontario’s school information and student demographics dataset provides a school-by-school spreadsheet outlining provincial achievement data, proportion of students receiving special education supports, proportion of students whose families live below the low-income cutoff and more.
Data available by application or through fee-for-service.
It is not reasonable to assume that all data will be publicly available, particularly if it includes student-level variables or sensitive information. Provinces, territories, and statistical agencies hold more data than they can publicly release, and universities or private companies (such as Environics Analytics) also hold datasets that relate to K-12 education. These datasets may have important information but are not made available for resource, privacy or proprietary reasons. In these cases, users have to apply for access, they may have to meet requirements in terms of expertise, submission of project proposals and/or pay data access fees. To conduct some analyses, researchers need to visit in-person data centres after approval through an application process.
National indicators
The starting point for pan-Canadian education data is the Pan-Canadian Education Indicators Program (PCEIP), run by the Canadian Education Statistics Council. This council is a joint project between Statistics Canada (StatCan) and the Council of Ministers of Education, Canada (CMEC). Every 6 months the PCEIP releases its Education Indicators in Canada report showcasing the indicators that have been coordinated Canada-wide. Many of these indicators are available at the level of province or territory. PCEIP indicators include:
- A profile of school-aged children (immigration status, percent visible minorities, percent in low-income households, and other characteristics of Canadians aged 0 to 24 from the Census)
- Expenditures on education (how much money is spent both overall and per pupil)
- Educator information (number of educators, gender distribution, age distribution, compensation, and part- vs. full-time work status)
- Intended instructional time (in hours by age)
- Student enrolment
- On-time graduation rate (disaggregated by binary gender)
- Large-scale assessment results (based on a sample of the population, see below)
The publication of these indicators represents are a good example of intergovernmental cooperation, as all 13 Canadian jurisdictions need to agree on definitions and reporting standards to be able to release any data.
Together, the PCEIP indicators provide important information that can help track progress over time. However, it remains difficult—if not impossible—to link these sources of information together or with data collected by provinces or territories. And there is currently little or no pan-Canadian information on (a) the kinds of programs and resources available in schools, (b) the links between students’ outcomes and their demographics, and (c) their progress through the continuum of learning from early childhood through and beyond post-secondary education.
For example, the PCEIP report indicates the percentage of children who are in low-income households and the percentage of students who graduate on time (within 3 years after entering Grade 10), but the report provides no indication of the graduation rates for Canadian children coming from low-income households as compared to those who are not from low-income households. In order to explore the relationship between these two indicators, researchers would need to apply for access to the underlying data. Different studies may have different rules about what data can be accessed.
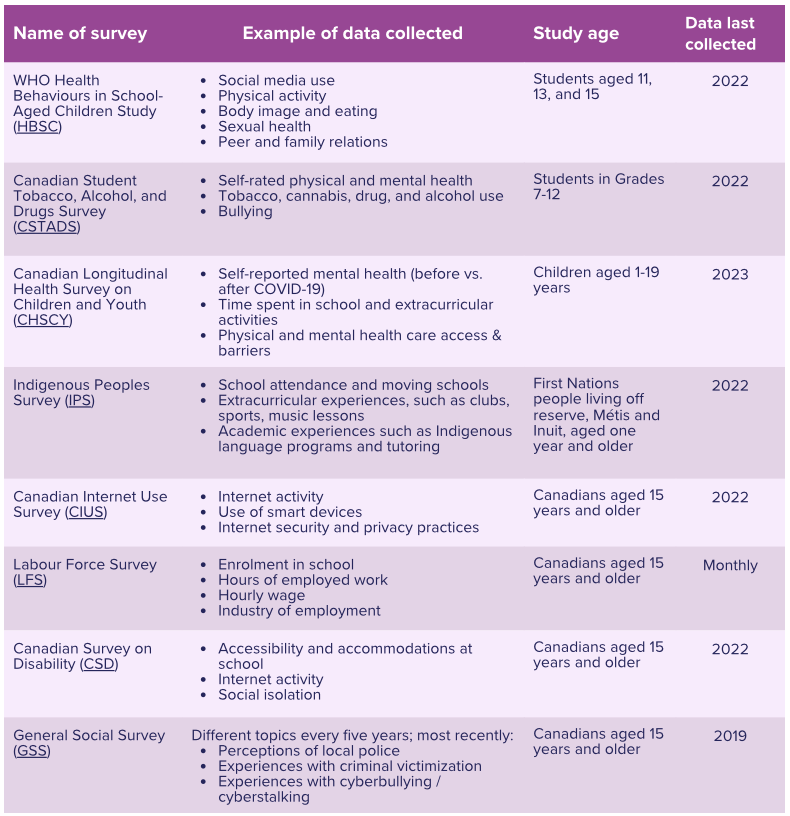
National survey data
There are also a number of surveys (listed below) that collect data about children and youth across the country using large, statistically representative samples of the student population. Some are targeted solely at school-aged populations or parents, and others include school-aged youth by sampling Canadians aged 15 and older. These surveys are all administered by StatCan (or by a university and/or international agency working in partnership with StatCan) and are generally representative of all Canadian regions, although they often exclude Canadians living in the three territories, reserves, remote communities, and institutionalized settings.
National linked datasets
In a significant linking project, StatCan has merged student-level data from every publicly funded post-secondary institution in the Postsecondary Student Information System (PSIS) with students’ later tax, Census, and employment data (through the Education and Labour Market Longitudinal Platform, or ELMLP). These linkages allow researchers and policymakers to study trends, plan policy, and evaluate the impact of changes to post-secondary education, the labour market or the economy. Access to this enormous dataset is by
application.
The ELMLP has also been merged with provincial student-level elementary and secondary school data in British Columbia and secondary school data in Ontario to provide even more powerful datasets that are available for researchers so that they can investigate the ways that earlier educational experiences shape later outcomes.
The type of elementary / secondary data that is linked includes things like course marks, graduation, and whether students have an exceptionality. For example, a report by Brown and colleagues explored how certain high school factors—such as suspension, absenteeism and credit accumulation—might be related to post-secondary attainment and later earnings.
Unfortunately, due to the provincial / territorial jurisdiction over data, the ELMLP is only linked to public schools in those two provinces, and therefore still only provide a partial picture of what matters in
Canadian education.
National and international student assessments and contextual questionnaires
Other critical sources of information that help policymakers and researchers monitor
educational progress are national and international large-scale student assessments in particular subject areas. These sample-based standardized tests are designed to provide feedback at a system level (e.g., How is Alberta education doing in math?) as opposed to feedback about individual students or schools. They also permit analysis of trends over time (e.g., What are the differences in learning outcomes before and after the pandemic?), outcomes across jurisdictions (e.g., How is Alberta doing in math compared to British Columbia?), or across subgroups of a population (e.g., How are boys achieving in math compared to girls?).
These assessments are not administered to every student, but to a sample of students that are statistically representative of the whole student population. This means that students and schools who participate in the assessments will get no feedback about their scores, but instead that data will contribute to an average score for the whole province or territory. This information is primarily intended to help inform policy decisions and allow opportunities to learn from other jurisdictions.
Every few years, a sample of students of a certain age complete one of three international assessments: the Organization for Economic Co-operation and Development’s (OECD’s) Programme for International Student Assessment (PISA every four years going forward), the International Association for the Evaluation of Educational Achievement’s (IEA’s) Progress in International Reading Literacy Study (PIRLS every five years) and some IEA’s Trends in International Mathematics and Science Study (TIMSS every four years). Canada also runs its own Pan-Canadian Assessment Program (PCAP) every four years with the last administration in 2023. These assessments test students’ academic progress in different subject areas (mainly mathematics, science, and reading) at different ages, and the scores are used to provide comparable data across provinces / territories or internationally about the performance of different education systems.
In Canada, provinces / territories choose independently whether to participate in large-scale assessments. For example, approximately 20,000 students from ten provinces (and no territories) participated in PISA 2022, which tested 15-year-olds in math, reading, and science, while only five provinces (Alberta, Manitoba, Ontario, Québec, and Newfoundland and Labrador) administered TIMSS to their Grade 4s and no Canadian regions participated in the TIMSS 2023 test for Grade 8s. This limits provinces’ ability to compare across regions. It also means that no sample-based assessment participated in by “Canada” has a truly representative sample of Canadian students. While the territories are not home to a significant portion of Canada’s population, without any territorial participation whatsoever—where conditions of schooling can vary greatly from southern Canada—it is difficult to make general claims about “education outcomes” across the whole country.
In conjunction with some of the academic tests, in some cases students, parents or school staff are asked to fill out questionnaires that provide more contextual information. This information might be about a students’ background (e.g., gender, parental education), their behaviours and habits (e.g., time spent working on homework daily), their or their family’s beliefs and interests (e.g., career aspirations, interest in arts or reading), the home environment (e.g., access to digital devices and books) or school learning conditions (e.g., teacher experience and professional learning, weekly time allocated to certain subjects).
These accompanying questionnaires can be used to help understand differences in achievement (e.g., What is the relationship between attitudes towards math and math achievement?), or they can provide important information about outcomes other than achievement. For example, in the most recent PISA cycle, the OECD reported on students’ sense of belonging and safety at school, parental involvement in learning, and experiences with support and discipline in math lessons. However, in Canada—for a range of reasons including limited capacity—the results from these questionnaires are rarely published, although data may be available to researchers by application.
Provinces and territories collect a great deal of data about education, both because they need the data to administer funding and because they need to report to the public on budgetary information and educational outcomes. However, governments collect much more data about schools than they share with the public, and provinces and territories must choose which datasets to prioritize sharing, resulting in variations in what is reported by provinces and territories across Canada.
Each province or territory (and the federal government) has an open data portal, where users can browse through these administrative datasets. Selected provincial / territorial datasets are available through the Canadian open data portal, but not all.
All provinces / territories report on the types of data that were included in the Education Indicators in Canada report mentioned above (e.g., enrolment, graduation rates, expenditures). However, beyond these few required indicators, there are no other data reporting standards across jurisdictions or from the federal government.
Administrative data on key success indicators
There are certain types of administrative and assessment data that are almost always collected and shared (whether through reports, dashboards or microdata files) by provinces and territories. These include:
- Graduation rates
- Some general demographic information (e.g., gender)
- Lists of schools that offer certain specialty programs
Other types of administrative data, although almost certainly collected, is not typically reported publicly. For example:
- School-level attendance rates (Nunavut and Northwest Territories report but others do not)
- Class size (British Columbia, Alberta, Ontario and Newfoundland and Labrador report)
- Teacher-student ratios (New Brunswick only)
- Credit completion (Northwest Territories reports and Manitoba for Grade 9 Math and English Language Arts)
Administrative data is often the best source of system-level “input” information, such as course enrolments, special education or language learner identification and supports, school disciplinary records, applications to postsecondary, and teacher qualifications: all factors with demonstrated impact on student achievement and equity. Most of this data is collected for purposes unrelated to research, and not all of it is readily available for analysis.
For example, in one board, records of students’ personalized education plans are kept on paper in a secure storage room. In at least one province, program information is actively de-linked from student identifiers which makes it difficult to understand relationships between what schools actually do and outcomes. Except for data subject to provincial reporting requirements, this type of administrative data is often not comparable between schools or boards because of local IT decisions.
In contrast, Manitoba has made an intentional effort to ensure that individuals’ administrative data can be linked, not just while they are in school, but also as they interact with different government agencies. The Manitoba Population Research Data Repository is an impressive data linking project that securely connects administrative and survey data across multiple sectors including healthcare, education, justice, and social services. Access is by application and can allow researchers and policymakers to see relationships between education and health or other social outcomes.
Census-based student assessments
In addition to the international large-scale sample-based assessments that were discussed above, every province and territory administers their own census-based standardized student assessments (where every student in certain grades are tested, either directly through a provincial government office or through an arms-length agency).1
These tests often serve multiple purposes at once: they can provide feedback to students’ families, teachers and schools about whether students have achieved a certain provincial standard along with information for school leaders and policymakers about the differences in achievement across populations and over time in response to policy and funding changes.
Students and their families, teachers, schools, and districts typically receive students’ individual scores, which can be used to target support as needed. Aggregate results are shared either at the district / regional level (e.g., PEI’s reporting) or at the school-level (e.g., through Ontario’s school information finder).
In secondary school, all jurisdictions (other than Saskatchewan) have some form of
standardized assessment as a graduation requirement. In most jurisdictions (Newfoundland, Nova Scotia, PEI, Québec, Alberta, Manitoba, Nunavut, and Northwest Territories), high school students must sit final standardized exams to achieve credit in certain subject areas and those exams contribute a certain proportion (typically 30%) of their final grade in the course.
In Ontario and the Anglophone New Brunswick system students need to achieve a minimum threshold on a literacy test to graduate, but the marks from that assessment are not necessarily included in their report card grades.
In Yukon and British Columbia, students must complete literacy and numeracy assessments to graduate, and while marks are not factored into students’ report cards, they are made available to universities and colleges as a part of students’ applications to post-secondary education.
Since these assessments vary in purpose, content, and targeted age, the results are not readily comparable with one another.
Surveys administered by educational authorities
Many educational authorities—provinces and territories or school boards—routinely survey students to collect more holistic data on student well-being or school experience. Some important examples and types of surveys are summarized below.
- Contextual surveys accompanying standards-based tests. Many provinces accompany
standards-based testing with contextual surveys of students or educators to help make
sense of results and support school improvement. - School climate or student well-being surveys. These types of surveys have been mandated in many provinces or territories and provide information about students’ physical and mental health and well-being, their classroom engagement, students’ peer and adult relationships, and how they spend their time outside of school. Sometimes climate surveys are standardized across a province or territory, while other times they are custom-built by a district and cannot be aggregated. Some tools are used by many boards or even provinces, including the Middle Years Development Instrument (MDI), which was developed by the University of British Columbia and is used by all of BC, or Tell Them From Me, a proprietary tool purchased by many school boards.
- School readiness measures. Many provinces and boards use the Early Development Instrument (EDI) to assess children’s readiness for school based on their teachers’ evaluation of their physical, emotional, social and cognitive development in kindergarten.
- Satisfaction or public perception surveys. The Alberta Education Assurance survey, which is administered to students, parents, and teachers to measure how satisfied these groups are with the public education system on domains like access to supports and services, education quality, and citizenship. A similar survey (The OISE Survey of Educational Issues) was administered to the general Ontario public from 1978 to 2018 by the University of Toronto.
- Board-administered surveys on student backgrounds and demographics. Some, but not all, provinces require boards or districts to collect some demographic data on their students and/or staff. Some boards may also survey without provincial mandates.
University researchers, unions, professional organizations and non-profits routinely conduct surveys that are intended not only to inform specific studies but also to form an ongoing body of data about education-related trends. Some examples include:
- The BC Adolescent Health Survey, which is administered by the McCreary Centre Society to youth in Grades 7 to 12 every five years and measures health trends, emerging issues, and risk and protective factors.
- The bi-annual Ontario Student Drug Use and Health Survey (OSDUHS), which is run by the Centre for Addiction and Mental Health (CAMH) and surveys Ontario students in Grades 7-12 on issues like substance use, mental illness, and social media use.
- The COMPASS study, which samples students in selected schools in Alberta and Ontario to learn about issues of health and well-being on a broad-reaching scope from physical activity to social media behaviour and mental health outcomes.
- The Canadian Teachers’ Federation Parachute survey series, a questionnaire about teachers’ work, stresses, well-being, and attrition.
- The Canadian Fitness and Lifestyle Research Institute’s Opportunities for Physical Activity at School Study, which collects data about health and physical education resources and facilities available at a random selection of schools across Canada.
The scan highlights that while Canada has strong examples of provincial, territorial, and national data collection efforts, significant challenges persist in ensuring that education data is complete, timely, comparable, and accessible.
Important information—such as race-based student data, school-level inputs, or links between demographics and outcomes—is often unavailable or restricted, limiting the ability of policymakers, researchers, and the public to fully understand and strengthen education systems.
Addressing these gaps could enable more robust monitoring of equity and outcomes, align Canada with international best practices, and support evidence-informed decision-making across the country.
Links to datasets identified in this scan are available at
https://peopleforeducation.ca/canada-education-data
Andrew-Gee, E., & Grant, T. (2019, January 26). In the dark: The cost of Canada’s data deficit. The Globe and Mail. https://www.theglobeandmail.com/canada/article-in-the-dark-the-cost-of-canadas-data-deficit/
Australian Curriculum, Assessment and Reporting Authority. (n.d.). My School provides information that helps parents and the community in understanding the performance of schools over time. My School. Retrieved August 26, 2025, from https://myschoolprodwebpmv3.azurewebsites.net/
Balkissoon, D. (2020, June 8). Canada’s dire need for better race-based data. Macleans.ca. https://macleans.ca/society/health/canadas-dire-need-better-race-based-data/
Brown, R. S., Walters, D., Parekh, G., Collis, R., Mishra, C., & Abdulkarim, F. (2024). A focus on the role of transfer, apprenticeship outcomes, and future income earnings. The Ontario Council on Articulation and Transfer (ONCAT).
Cardoso, T., & Doolittle, R. (2023, June 9). How The Globe created the first national database of FOI requests. The Globe and Mail. https://www.theglobeandmail.com/canada/article-investigating-freedom-of-information-laws/
Chatoor, K., & Tishcoff, R. (2024). Examining the role of sociodemographic characteristics in postsecondary non-completion and labour market outcomes. Higher Education Quality Council of Ontario. https://heqco.ca/pub/examining-the-role-of-sociodemographic-characteristics-in-postsecondary-non-completion-and-labour-market-outcomes/
Cowley, P., & MacPherson, P. (2022). Testing Canadian K-12 students—Regional variability, room for improvement: A cross-Canada comparison of K-12 provincial assessment programs. Fraser Institute. https://www.fraserinstitute.org/sites/default/files/testing-canadian-k12-students-regional-variability.pdf
Dyke, S. O. M., Saulnier, K. M., Pastinen, T., Bourque, G., & Joly, Y. (2017). Evolving data access policy: The Canadian context. FACETS, 1, 138–147. https://doi.org/10.1139/facets-2016-0002
Gallagher-Mackay, K. (2017). Data infrastructure for studying equity of access to postsecondary education in Ontario. Higher Education Quality Council of Ontario. https://heqco.ca/pub/data-infrastructure-for-studying-equity-of-access-to-postsecondary-education-in-ontario/
Gándara, D., Anahideh, H., Ison, M. P., & Picchiarini, L. (2024). Inside the black box: Detecting and mitigating algorithmic bias across racialized groups in college student-success prediction. AERA Open, 10, 23328584241258741. https://doi.org/10.1177/23328584241258741
Georgiades, K., MacMillan, H., Georgiades, S., Waddell, C., Szatmari, P., Vaillancourt, T., & Gruenwoldt, E. (2021). Data gaps are fueling crisis, during Canada’s children’s mental health Society of COVID-19 and beyond. (No. 77; RSC COVID-19 Series). The Royal Canada. https://rsc-src.ca/en/voices/data-gaps-are-fueling-canada%E2%80%99s-children%E2%80%99s-mental-health-crisis-during-covid-19-and-beyond
Gorur, R., Sellar, S., & Steiner-Khamsi, G. (2018). Big data and even bigger consequences. In World Yearbook of Education 2019. Routledge.
IBM. (2025). Cost of a data breach 2025. IBM. https://www.ibm.com/reports/data-breach
Riddle, S. (2023, February 21). The My School website has just been updated. What makes a ‘good’ school? The Conversation. https://doi.org/10.64628/AA.rnjf55psf
Robson, K. (2021). An essay on the challenges of doing education research in
Canada. Journal of Applied Social Science, 15(2), 183–196. https://doi.org/10.1177/19367244211003471
Sellar, S., Thompson, G., & Rutkowski, D. (2017). The global education race: Taking the measure of PISA and international testing. Brush Education.
Shwartz, V. (2024, February 13). Artificial intelligence needs to be trained on culturally diverse datasets to avoid bias. The Conversation. https://doi.org/10.64628/AAM.gjpx3pprd
The White House. (2025, March 20). Improving education outcomes by empowering parents, states, and communities. Executive Orders. https://www.whitehouse.gov/presidential-actions/2025/03/improving-education-outcomes-by-empowering-parents-states-and-communities/
Thomas, D., & Sands, C. (2023). Canada and the United States: Differences that count (5th Edition). University of Toronto Press. https://doi.org/10.3138/9781487544225
UK Department for Education. (n.d.). Compare school and college performance in England. UK Government. Retrieved August 26, 2025, from https://www.compare-school-performance.service.gov.uk/find-a-school-in-england
UN Committee on the Rights of the Child. (2022). Concluding observations on the combined 5th and 6th periodic reports of Canada (No.CRC/C/CAN/CO/5-6; Convention on the Rights of the Child). United Nations. https://digitallibrary.un.org/record/3978336
US Department of Education. (2025, February 13). U.S. Department of Education cancels additional $350 million in woke spending. US Department of Education. http://www.ed.gov/about/news/press-release-us-department-of-education-cancels-additional-350-million-woke-spending
1 Beginning in the 2025/26 school year, Saskatchewan will be the final region to introduce standardized tests, implementing English language arts assessments in Grades 4, 7, and 10, and mathematics assessments in Grades 5 and 9. Each of the territories administers assessments, but borrows them from other jurisdictions: Yukon borrows from BC and Northwest Territories and Nunavut borrow from Alberta.