People for Education's Annual report on Ontario’s publicly-funded schools is an audit of the education system – a way of keeping track of the impact of funding and policy choices in schools across the province. The report is based on survey responses from over 1100 principals in English, Catholic and French schools across the province.
Vital staff beyond teachers
- 61% of elementary schools and 50% of secondary schools report that they do not have sufficient access to a psychologist to adequately support students.
- 47% of elementary and 36% of secondary schools report that child and youth worker services are not available.
Schools as community hubs
Among schools that indicate community use,
- 9% of elementary and 21% of secondary schools offer integrated health and/or social services.
- 85% of elementary and 93% of secondary schools are used for recreational programs.
Libraries
- 52% of elementary schools had at least one teacher–librarian, either full- or part-time, a decline from 60% in 2008, and an all-time low in the 20-year history of the People for Education Annual Survey.
Arts education
- 40% of elementary schools have neither a specialist music teacher, nor an itinerant music instructor.
- Elementary schools in the GTA are 2.5 times more likely to have a music teacher than those in eastern and northern Ontario.
Health
- 42% of elementary schools have a Health and Physical Education (H&PE) teacher, either full- or part-time.
- The percentage of elementary schools with a H&PE teacher varies by region, from a high of 73% of elementary schools in the GTA, to only 15% of elementary schools in eastern Ontario.
Special education
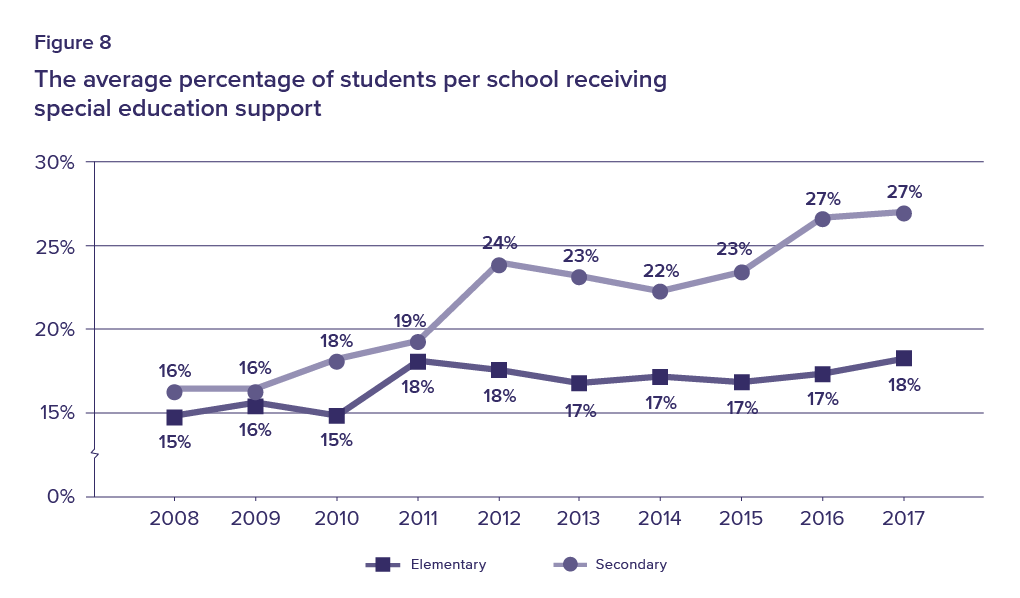
- An average of 18% of students in each elementary school, and 27% of students in each secondary school, receive assistance from the special education department.
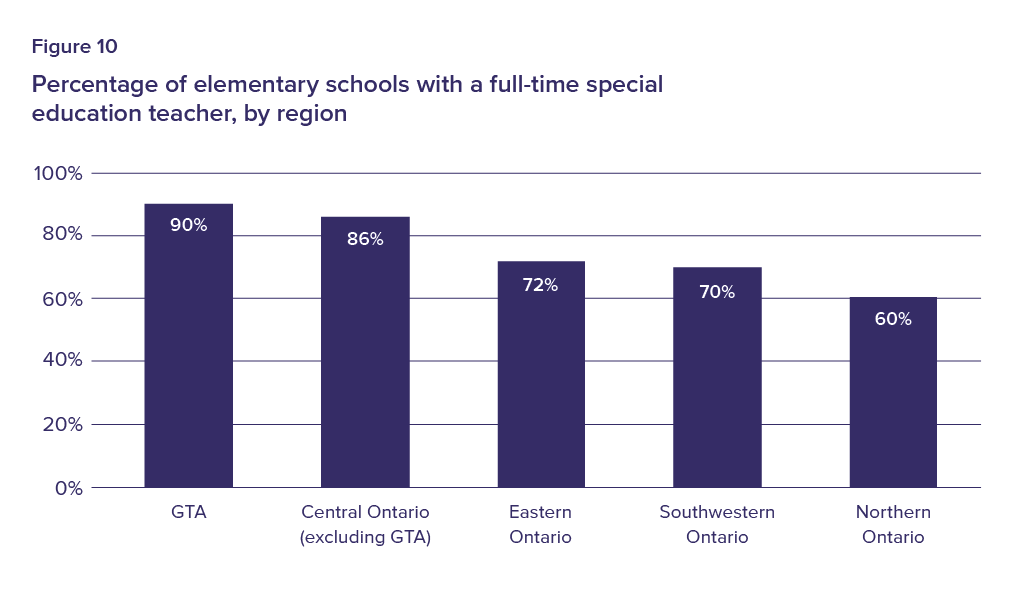
- 90% of elementary schools in the GTA have a full-time special education teacher, compared to 60% in northern Ontario.
Indigenous education
- 66% of elementary and 80% of secondary schools offer Indigenous education opportunities, up from 49% and 61%, respectively, in 2013.
- 40% of elementary schools bring in Indigenous guest speakers, up from 23% in 2013.
Language support
- 63% of English language elementary schools and 58% of secondary schools have English language learners.
- 76% of French language elementary schools have students who require French language support (ALF/PANA students), and on average, one in five students in these schools are receiving language support.
Career and life planning
- 34% of elementary and 56% of secondary schools report that every student has an education and career/life planning portfolio.
- The average ratio of students to guidance counsellors per secondary school is 380 to 1. In 10% of schools, that ratio is as high as 600 to 1.
Fundraising and fees
- 48% of elementary schools and 10% of secondary schools fundraise for learning resources (e.g. computers,
classroom supplies, etc.) - The top 5% of fundraising secondary schools raise as much as the bottom 83% combined.
I believe it is important for our students to understand the history of our country and to understand inclusivity…The main issue is we have many priorities, beyond academics, and sometimes it is difficult to complete any of them well…If everything is important, [then] nothing is important.
Elementary school, Upper Grand DSB
People for Education has been keeping track of the impact of policy and funding changes on Ontario schools for 20 years. In that time, governments have changed, parts of the provincial funding formula for education have been revised, knowledge about education itself has evolved, and a multitude of education policies have been implemented.
Ontario schools do very well in terms of literacy and numeracy scores, and graduation rates. But long-term success in today’s complex world requires more than achievement in the 3 R’s.
We’ve had to reduce the time allotted to Arts education in our timetable to allow for 300 minutes of Math each week and 200 minutes of French.
Elementary school, Toronto DSB
This year’s report is based on survey results from 1,101 elementary and secondary schools in 71 of Ontario’s 72 school boards, representing 22% of the province’s publicly funded schools. The report shows that principals and education staff are struggling to deal with competing priorities, and that they face challenges in ensuring that all students have access to an education that will equip them with the academic, creative, citizenship, social-emotional, and health competencies they need—no matter what their future path.
For this reason, we are making four overall recommendations:
- Education in rural and northern Ontario: Areas with smaller schools have fewer resources, and are struggling to provide adequate infrastructure to support the rich education their students need and deserve. The inequities between schools in urban areas and those in Ontario’s small towns suggest that the funding formula is not responding well to the needs of our rural and northern communities.
- People for Education recommends—with urgency—that the province substantially revise the funding formula so that it provides equitable support and opportunities for all students, no matter where they live.
- Policy overload: Ontario has a vast array of overlapping and, at times, redundant initiatives, programs, and frameworks that target everything from career education, to student success, to social-emotional learning, well-being, and health. Many principals in this year’s survey reported that a combination of competing priorities and a lack of resources is creating strain in the system. Ensuring that schools are able to provide Ontario’s young people with the supports and education they need to develop a broad range of competencies and skills requires greater clarity and policy coherence.
- People for Education recommends that the Ministry of Education undertake a review to evaluate and rationalize the plethora of programs, and develop a coherent approach so that all initiatives share common language and common goals.
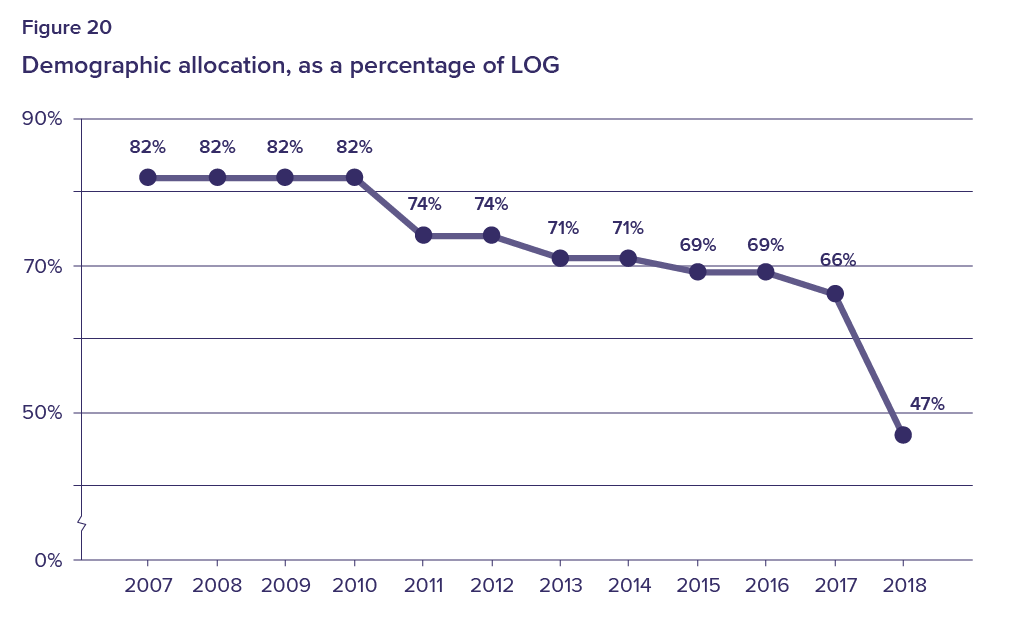
- Equity in education: When it was first developed 1997, Ontario’s Learning Opportunities Grant was intended to provide support—based on boards’ demographics—for programs and resources for students whose socio-economic status meant they may face barriers to success and greater challenges in school. At that time, the government-appointed expert panel recommended that the province set the grant at $400 million. In today’s dollars, that funding should total $564.2 million. The reality is far lower. The demographic portion of the 2017/18 Learning Opportunities Grant is $358.2 million. Over the past decade, the province has reduced the proportion of the grant based on demographics from 82% to 47%. The funding changes have resulted in a shift away from the grant’s foundational purpose of ‘redistributive equity.’
- People for Education recommends that the province divide the current Learning Opportunities Grant into two grants—one focused on student success, and one specifically focused on redistributive equity. The new “equity in education grant” should support resources, programs, opportunities, and strategies that have been shown to mitigate the impact of socio-economic factors on students’ chances for success in school.
- Indigenous education: This year’s results show a substantial improvement in Indigenous education programs in Ontario’s schools. More than two-thirds of schools now offer Indigenous education opportunities, where less than half did in 2014. These programs include things like professional development for staff, cultural support programs, and consultation with Indigenous communities. However, contrary to advice from Indigenous stakeholders, the province continues to measure success for Indigenous students based solely on literacy and numeracy scores, credit accumulation and graduation rates. In 2014, the Ministry of Education committed to work with First Nation, Métis, and Inuit partners and key education stakeholders to “explore and identify additional indicators of student achievement…well-being and self-esteem.”
- People for Education recommends that the province establish a new set of relevant indicators of student success that are more congruent with the interests, needs, and motivation of Indigenous communities, and vital for all students’ success in school and life.
Principals, teachers, and other education workers are bombarded with information and expectations. The expectation of the email senders and policy makers seems to be that when they click the send button, their program is implemented. There are so many of these initiatives and projects on the go that most people are confused about the direction we are going or how to go about prioritizing what is going on.
Elementary school, Hamilton-Wentworth DSB
In 2017:
- 61% of elementary schools and 50% of secondary schools report that they do not have sufficient access to a psychologist to adequately support students.
- 47% of elementary and 36% of secondary schools report that child and youth worker services are not available.
- 49% of elementary and 81% of secondary schools have regularly scheduled access to a social worker.
Teachers do not work alone, and a school community consists of more than individual classrooms. The whole school environment supports student success by encouraging academic achievement1 and ensuring the physical, social, and emotional well-being of students.2
Every day, individuals from a variety of backgrounds and experience come together in schools to help students achieve their academic and personal goals. They often go beyond their assigned roles, connecting with students and providing both formal and informal support and guidance.
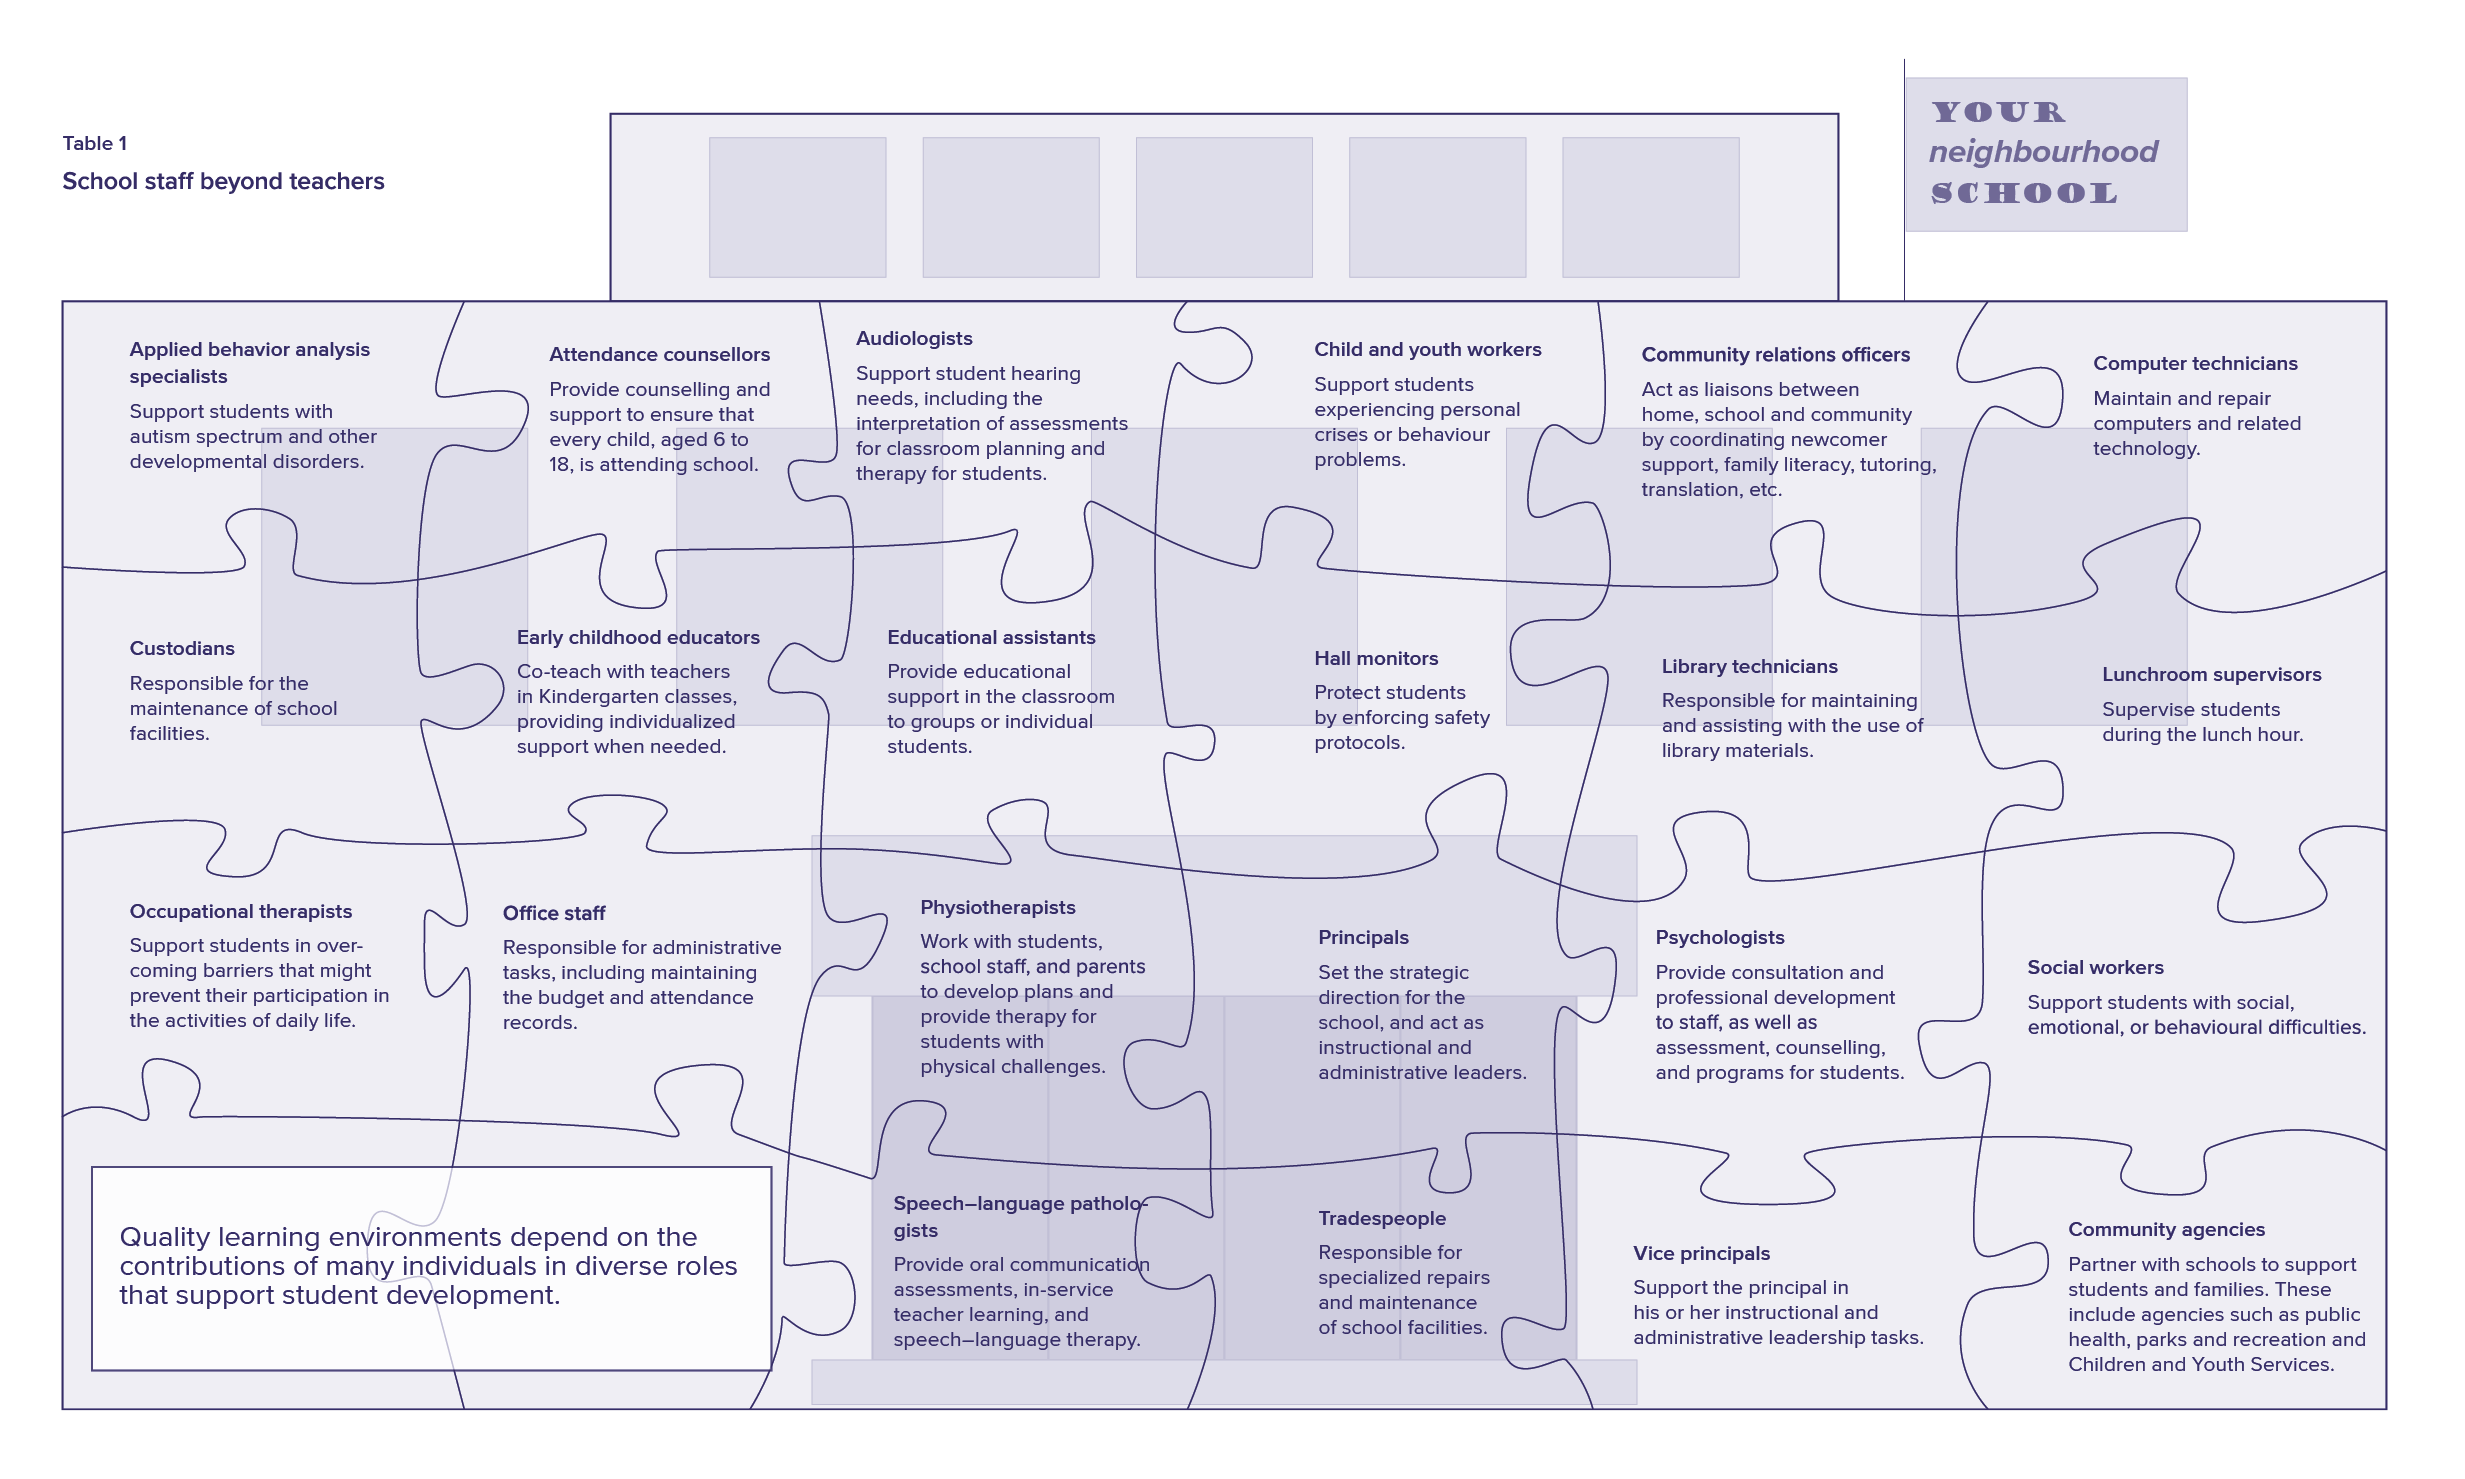
Alongside teachers, staff such as psychologists, attendance counsellors, child and youth workers, computer technicians, educational assistants, and administrators work with students on a daily basis.3 Table 1 provides an overview of the many people who support student learning. In this year’s survey, People for Education collected information about psychologists, social workers, child and youth workers, and speech-language pathologists.
Funding for professionals and para-professionals
Funding for non-teaching staff is provided through several Ministry of Education grants, including the Pupil Foundation Grant, the School Foundation Grant, and several Special Purpose Grants. Professionals and paraprofessionals (such as psychologists, social workers, child and youth workers, speech–language pathologists, hall monitors and lunchroom supervisors) are funded in the Pupil Foundation Grant at a rate of one for every 578 students in elementary schools, and one for every 452 students in secondary schools.4 School boards can hire professionals and paraprofessionals at their own discretion, according to the needs of their school communities. Because funding for these positions is pooled, increased spending on one type of position means there is less funding for other positions.
Psychologists
School psychologists5 are mental health professionals who can assess students’ special needs, as well as diagnose mental health problems, provide intervention, and assist teaching staff in supporting struggling students.
In 2017:
- 38% of elementary and 40% of secondary schools report they have regularly scheduled access to a psychologist.
- 49% of elementary and 45% of secondary schools report that they have on-call access to a psychologist.
- 13% of elementary and 16% of secondary schools report that psychologist services are not available.
- 61% of elementary and 50% of secondary principals report they do not have sufficient access to psychologists to adequately support students.
Based on the increasing mental health issues students are facing, there just isn’t enough time for our social worker/psychologist to meet the demands of all the students needing support. That being said, the time students do have with these individuals is supportive and encouraging.
Secondary school, Peel DSB
“The mental health needs of our students are, at times, overwhelming”6
In 2011, the Ontario government introduced Open Minds, Healthy Minds, a comprehensive ten-year mental health and addictions strategy.7 One of its overall goals was to “identify mental health and addictions problems early, and intervene.”8 The strategy identifies a need to build “school-based capacity,” including enhancing mental health resources in schools.9 School boards are provided with funding for a Mental Health Leader, to create “a more integrated and responsive child and youth mental health and addictions system.”10 This funding is “enveloped” (i.e. to be spent only on the specified area).
In their survey comments, principals—particularly in secondary schools—report significant concerns about providing mental health support.
Our adolescent care worker plays a vital role in the lives of many of our students. Community services for drug and alcohol and mental health also provide critical assistance for many students. Unfortunately, there is a need for even more services in all of these areas. The mental health needs of our students are at times
overwhelming.Secondary school, Limestone DSB
According to the Ontario Psychological Association’s guidelines, school boards should employ one school psychologist for every 1000 students.11 However, the Association of Chief Psychologists with Ontario School Boards recently reported that the ratio of psychology staff to students is, on average, over 1 to 3,500, and has reached 1 to 8,000 in some cases.12
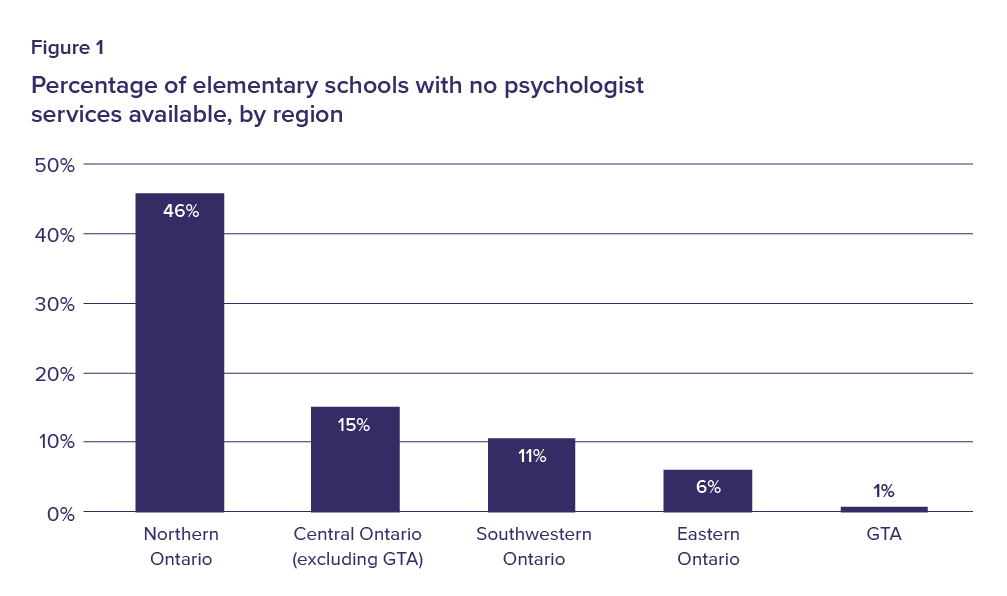
In the 2017 survey, 61% of elementary principals and 50% of secondary principals report insufficient access to psychologists to meet the needs of their students. Almost half of schools report that they have access to a psychologist only on an on-call basis.
Special education assessments
Although the Ministry of Education sets criteria for special education exceptionalities, school boards determine their own special education identification processes. In some cases, students can only access certain special education services after a professional assessment.13 These assessments provide vital information to the Identification, Placement, and Review Committee (IPRC) process. IPRCs determine whether a student meets the criteria for formal identification and the appropriate support for that student. Assessments provide diagnoses, if applicable, as well as information about the child’s learning profile and relevant educational recommendations. According to the Association of Chief Psychologists with Ontario School Boards, assessments can take as long as 20 hours.14
Psychologists and other professionals report they are pulled in multiple directions due to the need for assessments, counselling, and consultation. They say that the pressure to complete assessments affects their ability to provide other services.15
Support is not always available—psychologist is used mainly for assessing, not for counselling on a regular basis; social worker is able to talk with approximately three students on her half[-day] weekly visit; speech pathologist mainly for assessing and observations, also half a day once a week; weekly visits can be missed due to crisis at another school, or meetings.
Elementary school, Ottawa-Carleton DSB
Child and youth workers, social workers, and speech-language pathologists
This year’s survey results indicate that many schools have limited access to professional and paraprofessional services.
Access to child and youth workers (CYWs):
- 35% of elementary and 45% of secondary schools report having regularly scheduled access to CYWs.
- 47% of elementary and 36% of secondary schools report that CYW services are not available.
- 71% of elementary and 54% of secondary principals report that they do not have sufficient access to CYWs to adequately support their students.
Access to social workers:
- 49% of elementary and 81% of secondary schools report having regularly scheduled access to a social worker.
- 15% of elementary and 6% of secondary schools report that social workers are not available.
- 55% of elementary and 47% of secondary principals report they do
not have sufficient access to a social worker to adequately support their students.
Access to speech–language pathologists (SLPs):
- 51% of elementary and 10% of secondary schools report having regularly scheduled access to SLPs.
- 2% of elementary and 10% of secondary schools report that no SLP services are available.
- Only 37% of elementary and 28% of secondary principals report that they do not have sufficient access to SLPs to adequately support students.
In French language school boards, the issue of access is compounded by language barriers. In some communities, schools report that they can only access Anglophone professionals and paraprofessionals.
Progress can be seen in students who receive services on a regular basis. On the other hand, sessions in speech therapy, for example, are given in blocks. Once the block is over, there is no support to continue, even if the goals are not met…The social worker does not come to school unless we have cases. I think at this point, we should give children preventative sessions, instead of intervening when everyone is in shock, or crisis, and they do not want to receive services, as they are not seeing clearly.
Elementary school, CSDC Centre-Sud16
Our speech therapist is a four-hour drive from our community, so local services, once we are off the waiting list, come from an outside, English-speaking organization.
Elementary school, CSDC des Aurores boréales17
In 2017:
Among schools that indicate community use,
- 9% of elementary and 21% of secondary schools offer integrated health and/or social services.
- 65% of elementary and 25% of secondary schools are used for childcare and family resource centres.
- 85% of elementary and 93% of secondary schools are used for recreational programs.
Our school opens its doors and welcomes the entire community in general, not just our school community.
Elementary school, CS Viamonde20
Publicly funded schools can play an important role in strengthening the communities they serve.18 In recent years, the province has made modest investments to support Ontario’s schools in acting as community hubs, including $28.1 million dollars to help with the costs of keeping schools open after hours for community use.19
Ontario’s strategy for community hubs
In 2015, the provincial government released the recommendations from the Premier’s Community Hubs Advisory Committee—Community Hubs in Ontario: A Strategic Framework and Action Plan.21 The recommendations provided a framework to support the creation of community hubs throughout Ontario, as a means of improving access to services and providing more efficient use of government resources.22 While libraries, neighbourhood centres, and other community-based organizations can serve as community hubs, the province has identified schools as an “ideal location” for them.23
As a community hub, a school can be a focal point for health and social services, cultural and recreational events, and other home–school-community partnerships.24 While 69% of elementary and 64% of secondary schools report serving as community hubs, access to the school is, for the most part, limited to childcare, sports and recreation activities.
The school gym is used every night to provide extra-curricular activities for children in the community. We host a literacy program for parents of children 0–6 years old on Thursday mornings. We have a very successful day care and before- and after-school programs at the school.
Elementary school, York CDSB
Of schools that report community use of their space:
- 9% of elementary and 21% of secondary schools offer integrated health and social services.
- 13% of elementary and 29% of secondary schools are used for cultural programs and events.
- 5% of elementary and 19% of secondary schools are used for the arts.
- 65% of elementary and 25% of secondary schools are used for childcare and family resource centres.
- 85% of elementary and 93% of secondary schools are used for recreational programs.
Challenges to developing the school as a community hub
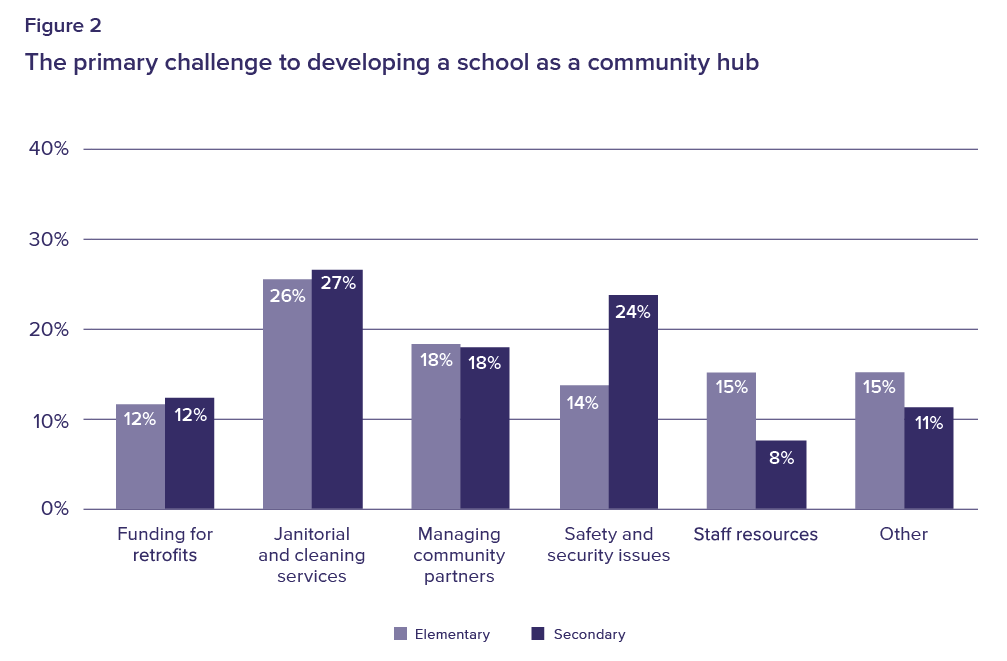
Schools report a range of challenges to developing the school as a community hub, but the most frequently cited impediments are janitorial and cleaning services, safety and security issues, and managing community partners (see Figure 2). A number of schools commented that scheduling cleaning and maintenance, and finding ways to ensure security after school hours, were challenges that they were unable to resolve.
The school gets run down quickly with so many other users, and caretaking services [are] not able to keep up with [the] demand.
Secondary school, Toronto DSB
Many principals also commented that a lack of school space restricted partnering capabilities. They report that their schools are already over-capacity, and that space constraints limit the potential for increasing community use of the school.
One of the challenges identified by schools in rural locations was a lack of community partners for them to engage with.
Being rural, there doesn’t seem to be anyone to really partner with. Knowing who to reach out to [is a challenge]. Nothing is close by.
Elementary school, Upper Grand DSB
In 2017:
- 52% of elementary schools had at least one teacher–librarian, either full- or part-time, a decline from 60% in 2008, and an all-time low in the 20-year history of the People for Education Annual Survey.
- 68% of secondary schools report a teacher–librarian and only 55% have a full-time teacher–librarian.
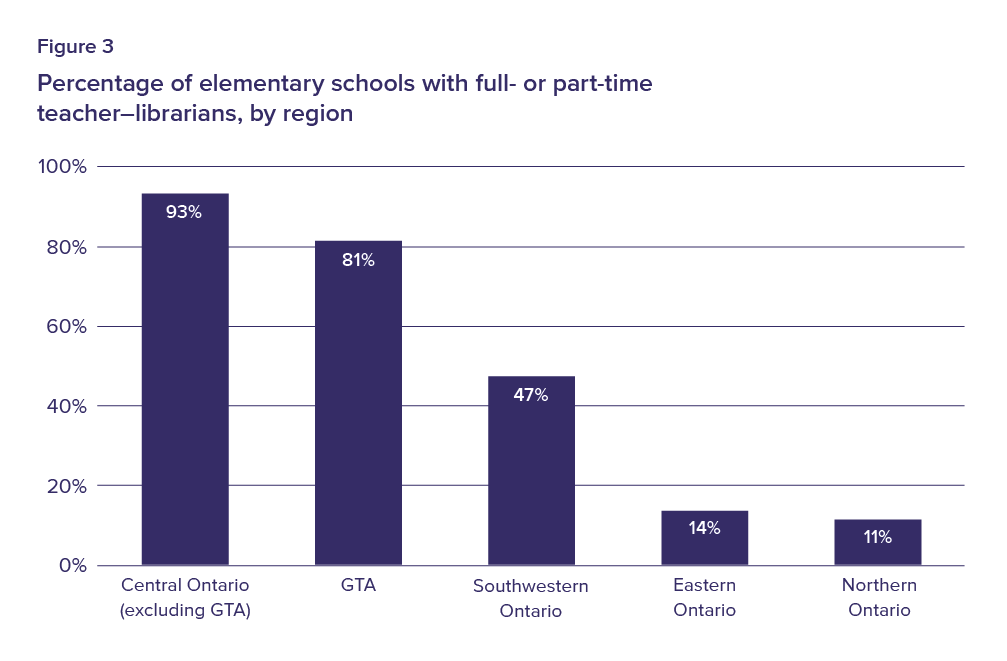
- 81% of elementary schools in the GTA have a teacher–librarian, compared to 14% of schools in eastern Ontario and 11% in northern Ontario.
Today’s school libraries are more than a place where students go to borrow books. Libraries are often described as “learning commons” for the school, where resources are shared in physical and virtual spaces, allowing students to collaborate.25 The idea behind the library-as-learning commons model is that students develop a variety of skills and competencies, including literacy, inquiry, and problem-solving, while engaging in collaborative and empowering learning experiences.26
Changes in staffing in Ontario school libraries
In 2017, only 52% of elementary schools reported having a full- or part-time teacher–librarian. This is an all-time low in the 20-year history of the People for Education Annual Survey, down from 80% in 1998.
In 2017:
- 11% of elementary schools have a full-time teacher–librarian and 41% have a part-time teacher–librarian.
- 68% of secondary schools have a teacher–librarian on staff: 55% full-time and 13% part-time.
In its report, Achieving Information Literacy: Standards for School Libraries, the Canadian School Library Association recommends a ratio of approximately one teacher–librarian to 567 students.27 In 2017, in schools with teacher–librarians, the average ratio per school is one teacher–librarian to 770 students in elementary schools, and one to 905 in secondary schools.
Regional inequities
Across Ontario, there are substantial regional variations in access to teacher–librarians. While 81% of elementary schools in the GTA have a teacher–librarian, only 14% in eastern Ontario and 11% in northern Ontario (see Figure 3) report having one.
Funding
Currently, there is no provincial policy or program guideline to ensure that all schools have fully functioning libraries. The Ontario curriculum, while confirming the importance of school library programs, contains the disclaimer “where available” in its references to teacher–librarians.28
Library funding is provided to school boards on a per pupil basis. Boards receive funding to cover the costs of one elementary teacher–librarian for every 763 elementary students and one secondary teacher–librarian for every 909 secondary students, but there is no requirement that boards use the funding on either teacher–librarians or other library staff.29 The Pupil Foundation Grant includes additional funds for library services, but boards can use these funds on other initiatives such as classroom computers, classroom teachers, textbooks, etc.
In 2016/17, the government allocated funding in the Learning Opportunities Grant to support elementary school libraries. Under this grant, boards receive $50,000 per school board plus $1,665 per elementary school to fund teacher–librarians and/or library technicians.30 This funding is enveloped—it can only be used for additional library staff, not for other expenditures such as the purchase of equipment or textbooks.
Library technicians in elementary schools
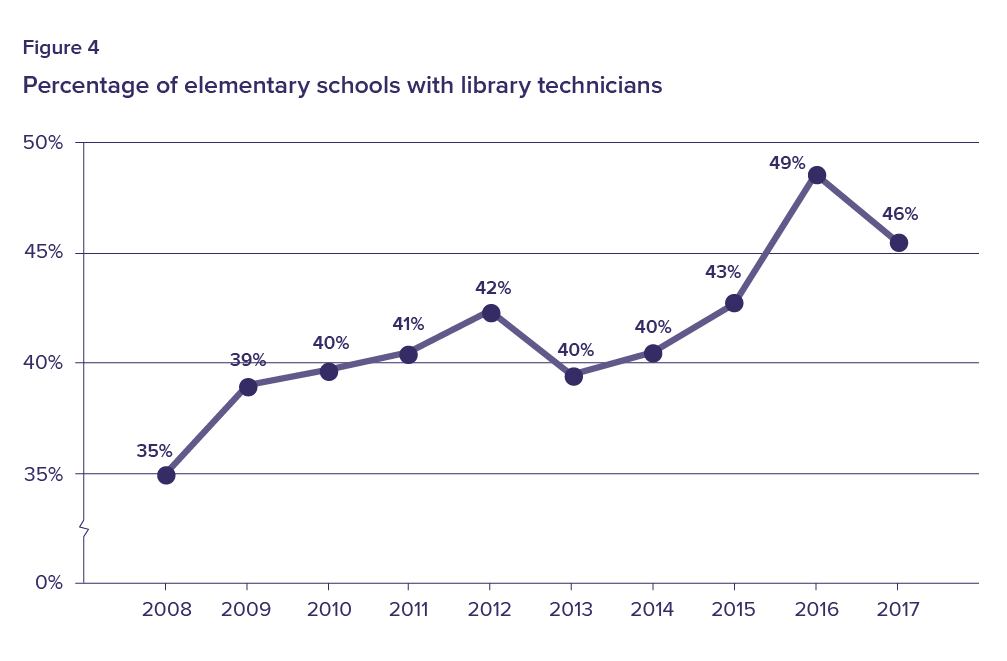
Forty-six percent of elementary schools have library technicians. Over the past ten years, the percentage of elementary schools with library technicians has been increasing (see Figure 4). Hiring library technicians rather than teacher–librarians may allow a school board to increase their library workforce. In the Ottawa CDSB, for example, elementary school libraries are now staffed with library technicians instead of teacher–librarians. Ottawa CDSB still employs teacher–librarians in its secondary schools.
Proven impact of school libraries
The Programme for International Student Assessment (PISA) found that in all countries surveyed, children who enjoyed reading performed significantly better on reading assessments than those who did not. On average, students who read daily for enjoyment score the equivalent of one-and-a-half years of schooling better than those who do not.31
A 2011 study by Queen’s University and People for Education, found that in schools with teacher–librarians, students were more likely to report that they “liked to read.”32 The study also found a significant relationship between students’ scores on reading and writing tests and the presence of either a teacher–librarian or a library technician.
These results echo the findings of many international reports. Forty years of research from Europe, U.S., and Australia indicates that well-staffed, well-stocked, and well-used school libraries are correlated with increases in student achievement.33 This is especially pertinent as EQAO has recorded a decline in self-reported reading enjoyment for elementary school students from 2012/13 to 2015/16.34
In 2017:
- 41% of elementary schools have a specialist music teacher, full- or part-time, a decline from 48% in 2008.
- Elementary schools in the Greater Toronto Area are 2.5 times more likely to have a music teacher than those in eastern and northern Ontario.
- 40% of elementary schools have neither a specialist music teacher, nor an itinerant music instructor.
- Only 8% of elementary schools with grades 7 and 8 have specialist drama teachers.
Education in the arts is a crucial component in the development of students’ cognitive, social, and emotional well-being.35 Creative opportunities in the arts “provide students experience with situations in which there is no known answer, where there are multiple solutions, where the tension of ambiguity is appreciated as fertile ground, and where imagination is honoured over rote knowledge.”36
In a commitment to prepare students to solve the complex problems of a globally connected world, the Ministry of Education has identified creativity as a key competency through which curriculum, pedagogy and assessment should be focused. As stated in the Ministry of Education’s 21st Century Competencies: Discussion Document, there are substantial and important connections between creativity, high academic achievement, economic and social entrepreneurialism, leadership, and problem solving.37
Challenging curriculum, fewer specialists
Elementary teacher candidates in Ontario are only required to take one course in the arts. However, Ontario’s Arts curriculum is extremely detailed, and requires in-depth knowledge, making it a challenge for teachers without specialized arts training.
There are four strands in the arts curriculum: dance, drama, music, and visual arts. These give students the opportunity to develop creative competencies through different forms of expression.
In 2017:
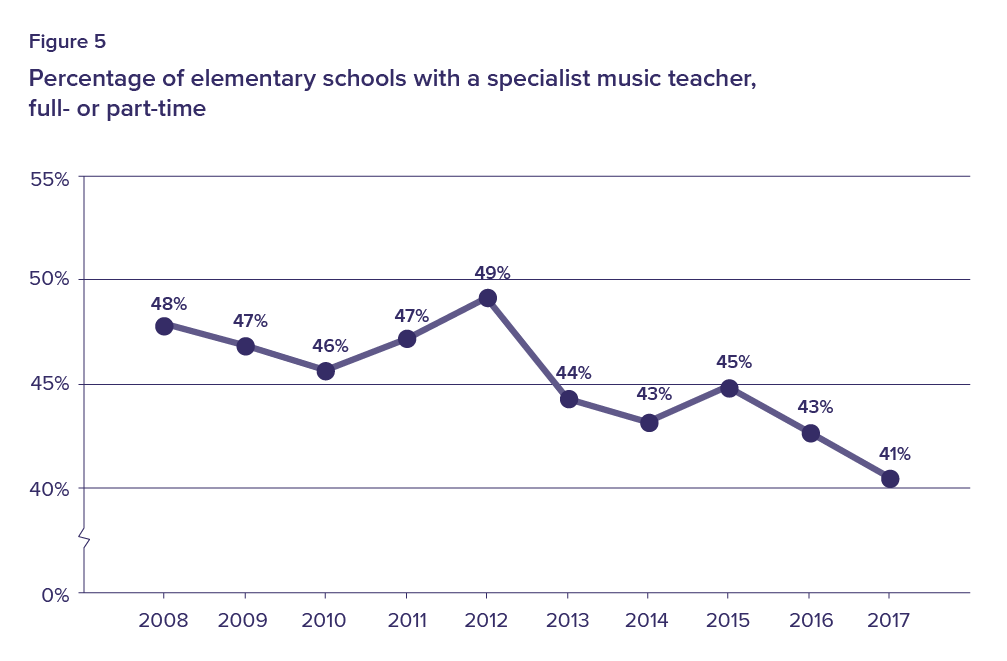
- 41% of elementary schools have a specialist music teacher, either full- or part-time, a decline from 48% in 2008 (see Figure 5).
- 40% of elementary schools in Ontario have neither itinerant music teachers/instructors nor specialist music teachers, compared to 31% in 2008.
- 15% of schools with grades 7 and 8 have a visual arts teacher, a consistent finding over the past decade.
- 8% of schools with grades 7 and 8 have a specialist drama teacher.
Principals report challenges
Many principals cited difficulties finding qualified music teachers in rural areas. Others pointed to challenges in hiring specialist teachers due to new regulations38 that may make it more difficult to hire teachers based on their specialty. A lack of space, instruments, and arts supplies were also identified as roadblocks. In addition, an underlying perception that other curriculum areas take priority over the arts can create scheduling challenges in schools.
Our challenge is resources—our budget is tiny, and we have limited access to [arts] support networks.
Elementary school, Upper Canada DSB
In order to fill the gaps, schools often look to outside community organizations or artists for help with regular programming, workshops and presentations. Funding for this may come from cuts in other parts of the budget, or through fundraising, which can lead to inequities among schools. A 2013 People for Education report found that elementary and secondary schools with higher fundraising levels—which are more likely to be in areas where families have higher than average family incomes—were more likely to report that students have the opportunity to see live performances.39 Schools with higher average family incomes were also more likely to offer opportunities to participate in a band, choir, or orchestra, perform in a play, or display their art.40
Regional discrepancies
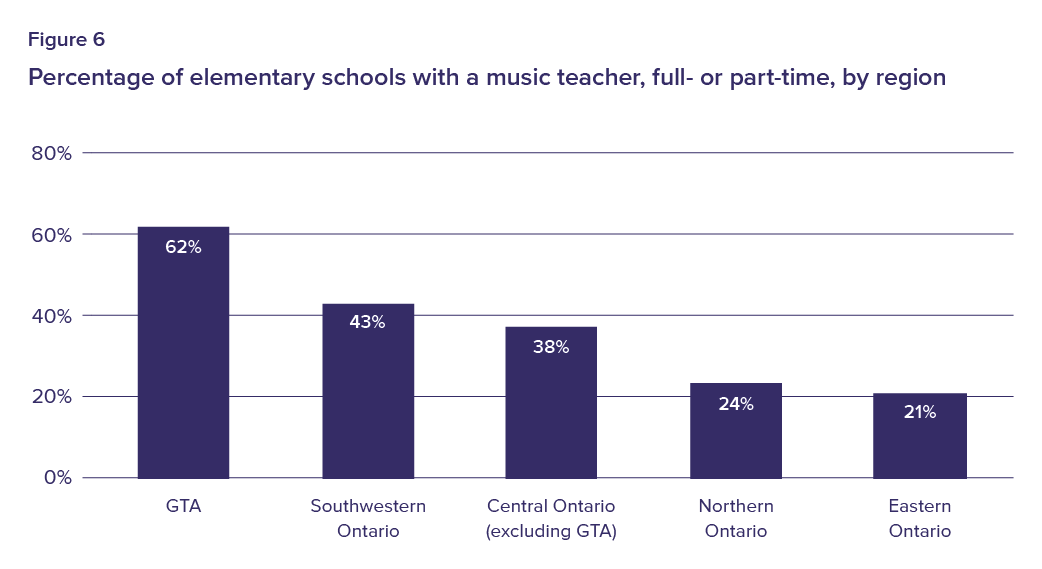
Because funding for specialist teachers in elementary schools is generated, for the most part, by numbers of students, areas with larger schools are more likely to have specialists. The average size of an elementary school with at least one full-time music teacher is 532—well over the provincial average school size of 341 students. Elementary schools in the Greater Toronto Area are 2.5 times as likely to have a music teacher, as compared to elementary schools in eastern and northern Ontario (see Figure 6).
In 2017:
- 42% of elementary schools have a Health and Physical Education (H&PE) teacher, either full- or part-time.
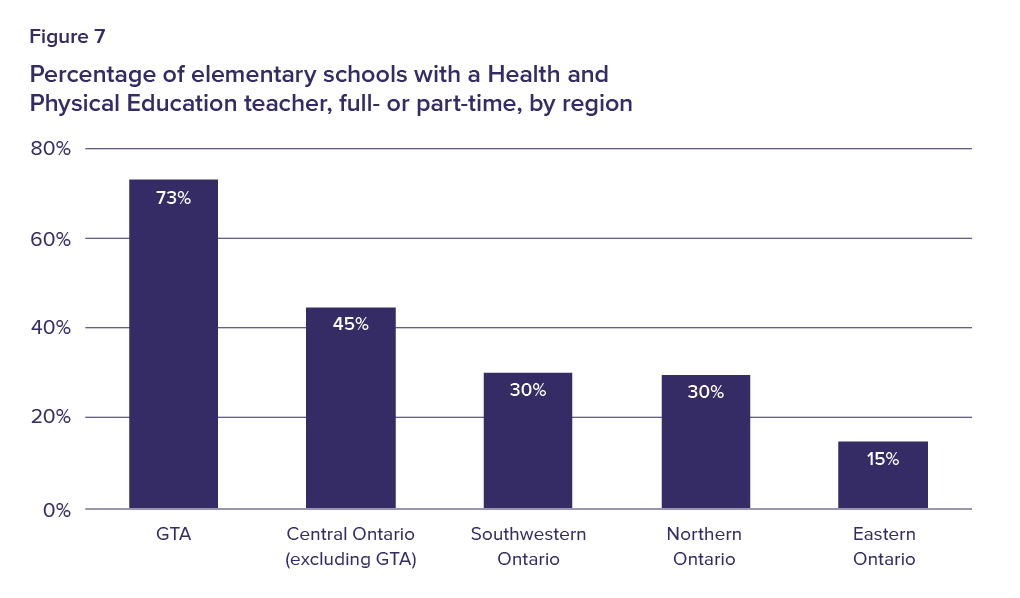
- The percentage of elementary schools with a H&PE teacher varies by region, from a high of 73% of elementary schools in the GTA, to only 15% of elementary schools in eastern Ontario.
Young people do better in school when they are healthy, and they are healthier when they do better in school.41
There are nearly two million young people in Ontario’s schools. The education system, where they spend much of their time, can have a profound effect on their physical, mental, emotional, and social wellness. The Ontario Ministry of Education has recognized the vital role of schools, not just in the province’s Health and Physical Education (H&PE) curriculum, but also by adding a responsibility for student well-being to Ontario’s Education Act.42
Teaching Health and Physical Education
While some provinces teach health as a subject separate from physical education, Ontario integrates the two.43 The H&PE curriculum takes a comprehensive approach, focusing on the skills students need to manage their health. Students learn about active living and movement competence in combination with other topics such as healthy eating, mental health, personal safety and injury prevention, substance use, addictions, and human development and sexual health.44
Ontario has comprehensive, evidence-based curriculum in place, but organizations such as UNESCO have found that well-qualified teachers are the key to unlocking the potential of H&PE curriculum and programs.45 Studies have found that students often have better health outcomes when they are taught by a H&PE specialist, compared to a classroom teacher,46 and they are more likely to be engaged in physical activity through intramural sports.47
In this year’s survey, only 42% of elementary schools report having a specialist H&PE teacher, either full- or part-time, a figure that has remained fairly consistent over the past ten years. But there are regional discrepancies in access to these teachers. Only 30% of schools in northern and southwestern Ontario have H&PE teachers, while in eastern Ontario this rate drops to 15%. Elementary schools in the GTA are almost five times more likely to have a specialist H&PE teacher, compared to schools in eastern Ontario (see Figure 7).
An effective school health program can be one of the most cost effective investments a nation can make to simultaneously improve education and health.
World Health Organization. School Health and Youth Health Promotion.48
Student well-being as a goal for education
In 2014, the Ministry of Education included “promoting well-being” as one of its primary goals for education in Achieving Excellence: A Renewed Vision for Education in Ontario. While many schools, school boards, and education unions have been promoting health in schools for decades,49 the inclusion of well-being as a key goal for the province cements education’s role in promoting healthy living for all students.50
The Ministry of Education is in the process of developing a specific strategy to clarify what well-being means, and how to monitor the province’s progress in promoting well-being.51
Well-being is a positive sense of self, spirit and belonging that we feel when our cognitive, emotional, social and physical needs are being met. It is supported through equity and respect for our diverse identities and strengths.
Ministry of Education, Ontario’s Well-Being Strategy for Education: Discussion Document.52
Promoting comprehensive school health
The World Health Organization recognizes school health programs as one of the most cost effective approaches to improving both health and education outcomes.53 A healthy school is a shared responsibility between staff, students, families, and community partners. Comprehensive school health can ensure that healthy approaches are embedded in all aspects of education and become a responsibility that is shared by all.
In this year’s survey, 59% of elementary schools report that they offer opportunities for recreational programs, and a further 6% of elementary and 13% of secondary schools offer integrated health and/or social services.
In 2017:
- An average of 18% of students in each elementary school, and 27% of students in each secondary school, receive assistance from the special education department.
- 64% of elementary and 55% of secondary schools report that there are restrictions on the number of students who can be assessed each year.
- 90% of elementary schools in the GTA have a full-time special education teacher, compared to 60% in northern Ontario.
Special education can take many forms. While students who have been formally identified with behavioural, communication, intellectual, physical, or multiple exceptionalities have a legal right to special education support,54 students who do not have a formally identified exceptionality may also receive help through special education programs and services. These supports can involve anything from extra time for writing tests, to special equipment to help students with their schoolwork.
Over the past 10 years, there has been an increase in the average percentage of students per school receiving special education services (see Figure 8).
Changes to the funding formula
The province allocated $2.76 billion in funding for special education in the 2016/17 school year.55 Half of this funding is provided through a Special Education Per pupil Amount (SEPPA), which is based on the total number of students in the school board.56 The SEPPA funds the additional assistance that the majority of special education students require—including EAs, psychologists, special education teachers, and a range of classroom supports. The remainder of special education funding is to cover the cost of supports for students with higher needs, including special equipment and facilities, separate classrooms, and special education teachers.57
In March 2014, the Ministry of Education announced major changes to special education funding, to be rolled out over four years.58 Since then, the Ministry has maintained the overall level of funding for special education, but has changed how funding is distributed among boards. The goal was to make the funding more responsive to boards’ and students’ needs. These changes have resulted in some boards getting more funding, while others receive less. Comments from schools indicate that the impact of these changes is being felt on the ground.
We have children in crisis…wait lists are long, we do not have the services the children require to be successful at school. It is heartbreaking. Cutting an additional million from our school board will have a catastrophic effect on the children. The Ministry needs to re-evaluate this current funding model.
Elementary school, Limestone DSB
Our in-school review committee works collaboratively to prioritize needs and to determine the most effective courses of action to support students. This is a highly collaborative team that is able to provide amazing advice to help support our students’ needs.
Elementary school, Peel DSB
Waiting for support
In 2017, an average of 9 students per elementary and 7 students per secondary school were waiting for professional assessment, IPRC, or placement.
Each school board is responsible for developing identification procedures and intervention strategies for its special education programs.59 The following procedures only apply to students who are formally identified with exceptionalities.60 They do not apply to the many students who are receiving special education services without a formal identification.
There are three steps in the formal identification process:
- Professional assessment by a psychologist, speech-language pathologist, physiotherapist, etc.
- Identification, Placement, and Review Committee (IPRC) meeting and decision regarding the appropriate identification, and a recommendation regarding placement, program or support.
- Placement in program or provision of appropriate support.
Extrapolating this year’s survey results province-wide, there are an estimated 37,000 students in Ontario waiting for professional assessment, IPRC, or placement.61
Restrictions on assessments
Based on available resources, some boards limit the number of students that principals can put forward for assessment each year.
Psychological assessment services are rationed essentially to the most needy one or two students a year. System level placements for our most needy students are rationed to an extent we are creating more problems during the wait time. There is a growing parent, staff and student belief that our schools are not the positive and safe places they once were.
Elementary school, Hamilton-Wentworth DSB
In 2017:
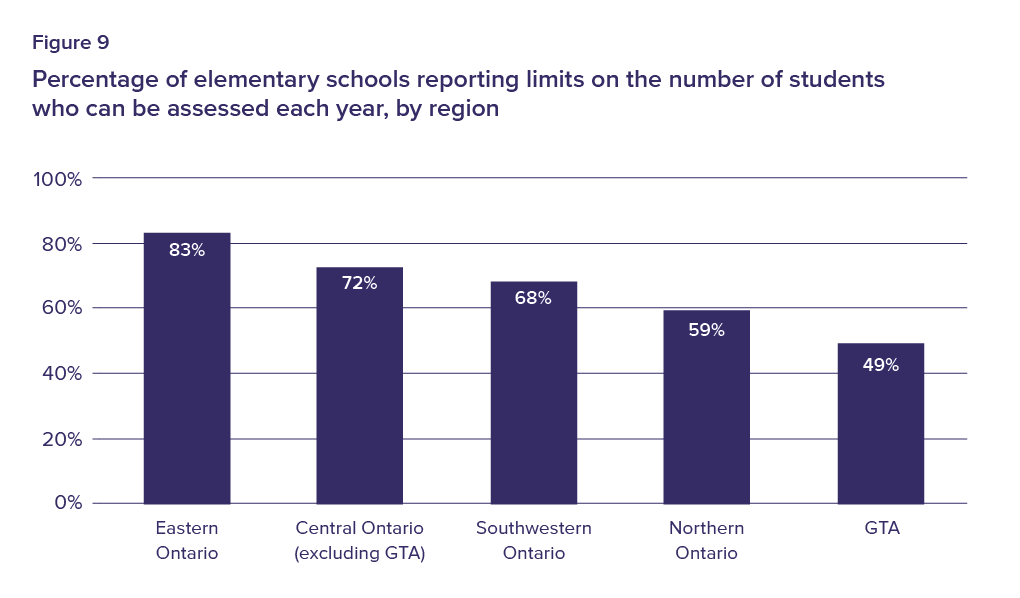
- 64% of elementary and 55% of secondary schools report restrictions on the number of students who can be assessed each year, an increase from 50% and 47%, respectively, in 2012.62
- The percentage of elementary schools reporting limits on the number of students who can be assessed ranges from 83% in eastern Ontario to 49% in the GTA (see Figure 9).
- 24% of elementary and 15% of secondary schools report that not all identified students are receiving recommended support.
Regional differences in special education support
The survey results show substantial regional discrepancies across Ontario in terms of access to special education resources. In 2017, 90% of elementary schools in the Greater Toronto Area and 86% in central Ontario report a full-time special education teacher, compared to only 60% in northern Ontario (see Figure 10).
Educational assistants
Eighty-eight percent of Ontario’s elementary schools have at least one full-time educational assistant (EA) supporting special education. Educational assistants support students in both regular and special education classrooms, and are involved in everything from helping with lessons to assisting with personal hygiene, to behaviour management.
Under Ontario’s funding formula, EAs in elementary schools are funded at a rate of one for every 5000 students, but supplemental funding through special purpose grants can improve that ratio significantly.63 In this year’s survey, elementary schools reported an average of one EA for every 22 students.
While there is a substantial discrepancy in the percentage of schools with special education teachers between GTA and northern Ontario elementary schools (see Figure 10), this trend does not hold for EAs. Eighty-five percent of elementary schools in northern Ontario have EAs, which is similar to the eighty-three percent in the GTA.
In 2017:
- 66% of elementary and 80% of secondary schools offer Indigenous education opportunities, up from 49% and 61%, respectively, in 2013.
- 23% of elementary and 49% of secondary schools have a designated staff member who coordinates Indigenous education.
- 40% of elementary schools bring in Indigenous guest speakers, up from 23% in 2013.
It is critical to raise awareness of these vibrant cultures, in the spirit of reconciliation and Canada’s commitment to its Aboriginal communities.
Elementary school, CÉP de l’Est de l’Ontario64
May 30, 2016, marked Ontario’s historic adoption of The Treaties Recognition Week Act65—legislation that designates the first week of November each year as Treaties Recognition Week. This is just one of the many initiatives introduced in Ontario to promote awareness, both in schools and with the broader public, about the treaties, rights, and responsibilities that we all have as citizens.
The legislation (the first of its kind in Canada) is a concrete example of how governments can implement the 2015 “Calls to Action” from Canada’s Truth and Reconciliation Commission (TRC) regarding the integration of Indigenous history/worldview in schools.66 Ontario’s response to the TRC continues to highlight the role of education in reconciliation; specifically teacher education, the Ontario curriculum, the preservation of Indigenous languages, and targeted supports for educators.67
Majority of Indigenous students attend provincially funded schools
Eighty-two percent of Indigenous students attend provincially funded schools in Ontario school boards, and virtually every school has Indigenous students enrolled.68 This reality, and the TRC’s recognition of public education as a key component in the reconciliation process, means that Ontario’s 5,000 schools can play a vital role in long-term change for both Indigenous and non-Indigenous students.
Over the last three years, there has been a marked increase in Indigenous educational opportunities in the province’s schools. This improvement may reflect both Ontario’s commitment to act on the TRC Calls to Action, and the continued implementation of Ontario’s First Nation, Métis and Inuit Education Policy Framework.69
Two of the key goals identified in the Framework are increasing all students’ and educators knowledge about “the rich cultures and histories of First Nation, Métis, and Inuit peoples,”70 and improving educational outcomes for Indigenous students.71 This year’s survey results indicate some progress toward these goals.
Increased Indigenous educational opportunities in schools
Since 2013, when we first asked about Indigenous education opportunities, there has been a fairly steady improvement in a number of areas. This year, 66% of elementary and 80% of secondary schools offer Indigenous education opportunities in some form (cultural support, language programs, guest speakers, ceremonies), up from 49% and 61%, respectively, in 2013. Examples of these opportunities range from replacing the mandatory grade 11 English course with an Indigenous literature course,72 or—as some boards have done—introducing a policy to recognize the land on which the school is built as a part of its daily opening exercises.73
Professional development for teachers
The TRC highlighted the importance of Professional Development (PD) for teachers, calling for post-secondary institutions to “educate teachers on how to integrate Indigenous knowledge and teaching methods into classrooms.”74 All of Ontario’s faculties of education are now required to provide mandatory Indigenous content in their teacher education programs.75 However, many teachers report receiving little education in this area, and many still report a low level of comfort teaching and speaking about Indigenous topics.76
Teachers teaching First Nation, Métis, and Inuit [courses] have received PD, but still feel very unqualified teaching First Nation, Métis, and Inuit from a relatively non-Indigenous perspective. They want to do a really good job and understand the importance, but they feel unsure.
Secondary school, Upper Grand DSB
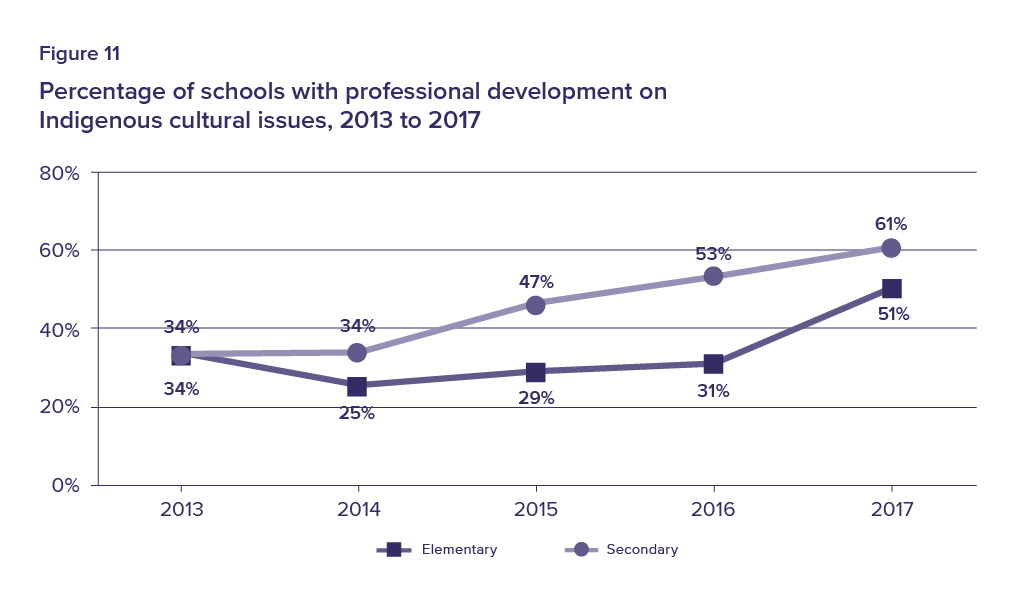
Ongoing PD can support teachers’ confidence in incorporating Indigenous perspectives in K to 12 classrooms.77 Since 2013, there has been a relatively steady increase in the percentage of schools offering PD around Indigenous cultural issues (see Figure 11).
Supporting achievement for Indigenous students
In the First Nation, Métis, and Inuit Education Policy Framework Implementation Plan, the Ministry of Education set 2016 as the target date for closing the gaps in education outcomes (i.e. literacy, numeracy, retention, graduation) between Indigenous and non-Indigenous students.78 According to the 2011 National Household Survey, 24% of Indigenous 20–24 year olds living off-reserve in Ontario did not graduate from secondary school. This is 15 percentage points higher than their non-Indigenous counterparts (9%).79
We have a staff member who has informally taken the lead on these issues. We believe that the first steps need to be in the area of education and awareness for staff and [all] students, and creating an environment where students feel comfortable to self identify.
Secondary school, Limestone DSB
The Implementation Plan also stated that the province would collaborate with First Nation, Métis, and Inuit partners, and key education stakeholders to explore and identify additional indicators of student achievement, well-being and self-esteem.80
The challenges faced by Indigenous students in provincial schools may reveal the need for a more comprehensive approach to ensure success. Part of the solution may be collaboration with multi-agency supports (e.g. health services, friendship centres), and with community-based programs that address issues of poverty, racism, housing, parental/guardian engagement and childcare.81
Infusing Indigenous pedagogy in education
We are a tri-lingual school where the languages and cultural diversity of all groups is celebrated. We are emphasizing the need to teach [the] positive contributions of Indigenous people throughout history while we discuss Indigenous people within the context of then and now.
Elementary school, Kawartha Pine Ridge DSB
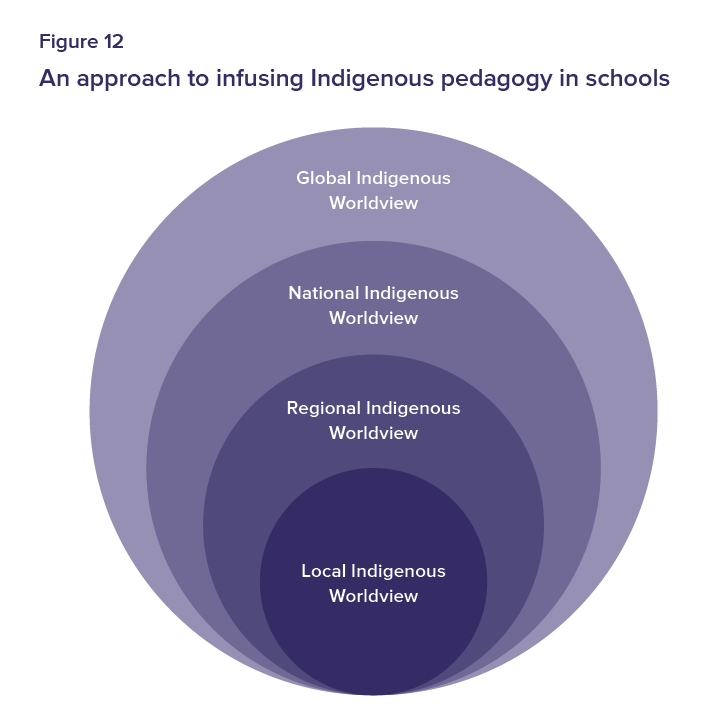
Some scholars refer to a need to “indigenize” education, a term that refers to the local, regional, national, and global perspectives of Indigenous peoples being seamlessly woven into a classroom and school (see Figure 12). This “indigenization” may mean, for example, that a school situated on Anishinabek lands will adopt a holistic approach to education that encompasses the physical, emotional, intellectual, and spiritual needs of the learners.82 This re-visioning of education (i.e. curriculum, assessment, teaching strategies, etc.) also requires a specific focus on local partnerships and resources, before incorporating the knowledge of Indigenous peoples outside of that traditional area.83 The local focus, in turn, requires staff time.
In 2017:
- 19% of elementary and 29% of secondary schools report that they consult with Indigenous community members.
- 23% of elementary and 49% of secondary schools report that they have a designated staff member at the school level who coordinates Indigenous education.
- 90% of elementary and 93% of secondary schools report that there is a designated staff member at the board level who is responsible for Indigenous education.
The Ministry encourages secondary schools to embed Indigenous themes and perspectives into existing courses via the First Nation, Métis, and Inuit Studies Allocation.84 In 2016/17, $24.8 million was allocated to schools, based on the number of students enrolled in First Nation, Métis, and Inuit Studies courses.85 Specifically, for every 12 students enrolled in a qualifying course, an extra 0.167 of a teaching position is allocated to the school.86 In one Bluewater DSB secondary school, the staff has developed an outdoor education course delivered in an Indigenous context.87 The course generates extra funding for the school and allows students to engage with Indigenous culture.
I believe that the educational opportunities need to be embedded within existing courses, as well as continuing to offer the [Current Aboriginal Issues In Canada course] and other stand-alone courses. Time release is needed for teachers to have time to develop this work within their own subject/course areas.
Secondary school, Peel DSB
Funding for Indigenous education
In 2016/17, $64 million was allocated to support learning as outlined in the Ontario First Nation, Métis and Inuit Education Policy Framework.88 The funding included support for a supervisory officer level position in each board to support the work described in the framework. Ontario is also beginning to phase in data from the Statistics Canada National Household Survey (NHS) to support more effective and targeted funding.89
Data from the NHS and from the Office of Ontario’s Auditor General show that both Indigenous enrolment and self-identification of Indigenous students are increasing steadily in Ontario schools. These increases may result in additional funding to address educational gaps and increase cultural opportunities for all students.90
In 2017:
- 63% of English language elementary schools and 58% of secondary schools have English language learners.
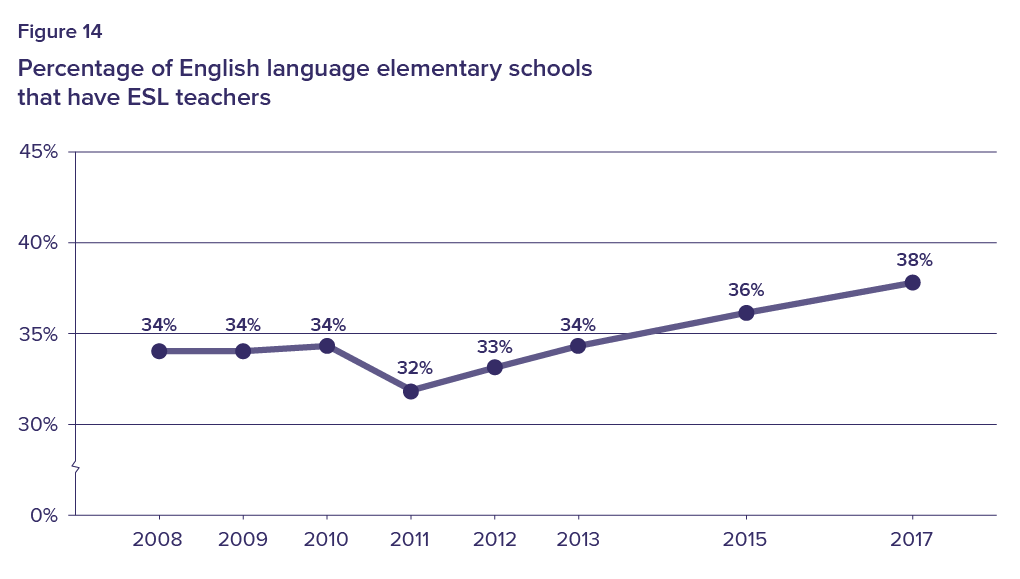
- 38% of English language elementary schools have English as a Second Language teachers, an increase from 34% in 2008.
- 76% of French language elementary schools have students who require French language support (ALF/PANA students), and on average, one in five students in these schools are receiving language support.
The 2011 Statistics Canada National Household Survey found that 3.6 million Ontarians were foreign-born—representing 29% of the total population, the highest proportion among all Canadian provinces.91 More than 1.8 million Ontarians, including approximately 50,000 third- or higher-generation residents,92 speak a primary language at home that is neither English nor French.93
Ontario schools provide specialized language programs for children whose first language is not the language of instruction at school (see Table 2).94 This support can include both recent newcomers and students whose families speak neither French nor English at home.
Table 2
Language support programs in Ontario
Program Name |
Description |
|
| ESL | English as a Second Language | The child’s first language is not English, but the child has had the opportunity to develop age-appropriate literacy skills in their first language. |
| ELD | English Language Development |
The child’s first language is not English and the child has significant gaps in their education or first-language literacy skills, possibly due to disruptions in schooling. |
| ALF | Programme d’actualisation de la langue française | The child’s first language is not French, but the child is from Canada. |
| PANA | Programme d’appui aux nouveaux arrivants | The child’s first language is not French and the child is new to Canada, meaning that their needs more support to integrate into his or her new community. |
Currently, the funding for English language learners (ELLs) is provided to school boards in two categories:
- Recent Immigrant Component: boards are allotted funding for students from non-English-speaking countries who are in their first four years in Canada. This funding gradually decreases over the four-year period.
- Pupils in Canada component: funding is provided to school boards based on Census data for children whose first language spoken at home is neither English nor French.95
Success for English language learners
Many families move to Canada with high aspirations for their children. This is borne out by data showing that 83% of immigrant children have aspirations to complete a university degree—a higher proportion than the 60% of children whose families have been in Canada three generations or longer.96
With our ESL teacher, these students feel connected to their school and all the supports available. And, their English improves!
Elementary school, Toronto Catholic DSB
Overall, immigrant students are achieving their academic goals. Newcomers tend to match or exceed the achievements of non-immigrant children on OECD’s Programme for International Student Assessment (PISA) (an international test administered to a sample of 15 years-olds every three years).97 In addition, childhood immigrants are more likely to graduate from high school and complete university than third- or higher-generation children.98
Some students arrive in Ontario with needs beyond the scope of English or French language learning programs. Ontario’s ELL policy states that in situations where students come from backgrounds with limited access to schooling, additional supports need to be provided.99 Despite this requirement, some principals commented that the needs of their students—beyond language acquisition—are not being met.
Greatest challenge is the ever-increasing amount of ELL students attending the school. Numbers are quickly rising and students with emotional/behavior needs is increasing as well, impacting the student’s readiness to learn.
Secondary school, Peel DSB
Challenges running small ELL programs
In communities where there are a high number of ELLs, or where there is a high proportion of ELLs in a particular school, ESL funding can cover the costs of a specialist teacher. But, for schools or boards where there are a small number of ELLs, it may be more difficult to support students’ language needs. Even for the group with the highest need—newly arrived students born in non-English speaking countries—funding is allocated at a rate of only $3,920 per student for their first year in Canada.100 For a school with only four or five ELLs, there may not be enough funding to hire dedicated staff or run a separate course.
It is an honour to have many students joining…our school from our partner communities in [Ontario’s] far north. Many students come with varied levels of fluency and challenges in academic school language. We have strong early years supports for literacy, but struggle to meet the needs of students who join us in grades 2–8.
Elementary school, Keewatin-Patricia DSB
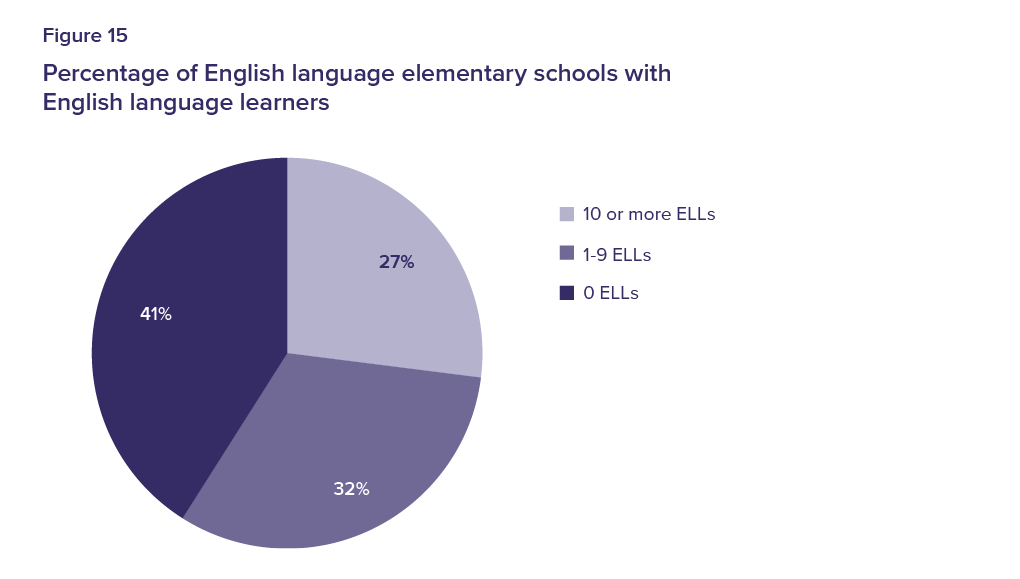
In 2017, 32% of English language elementary schools had fewer than 10 ELLs enrolled (see Figure 15). Among those schools, 76% have no ESL teacher.
Language support in French language schools
In the French-language system, 76% of elementary schools have French language learners in either the actualisation linguistique en français (ALF) program or programme d’appui aux nouveaux arrivants (PANA) (see Table 2). Among elementary schools with ALF/PANA students, an average of 20% are in these programs.
The ALF program contributes enormously to the development of the French language. It is essential to do this at the beginning of [a student’s] learning journey.
Elementary school, CSC Providence101
In 2017:
- 15% of elementary and 39% of secondary schools report they have career and life planning committees.
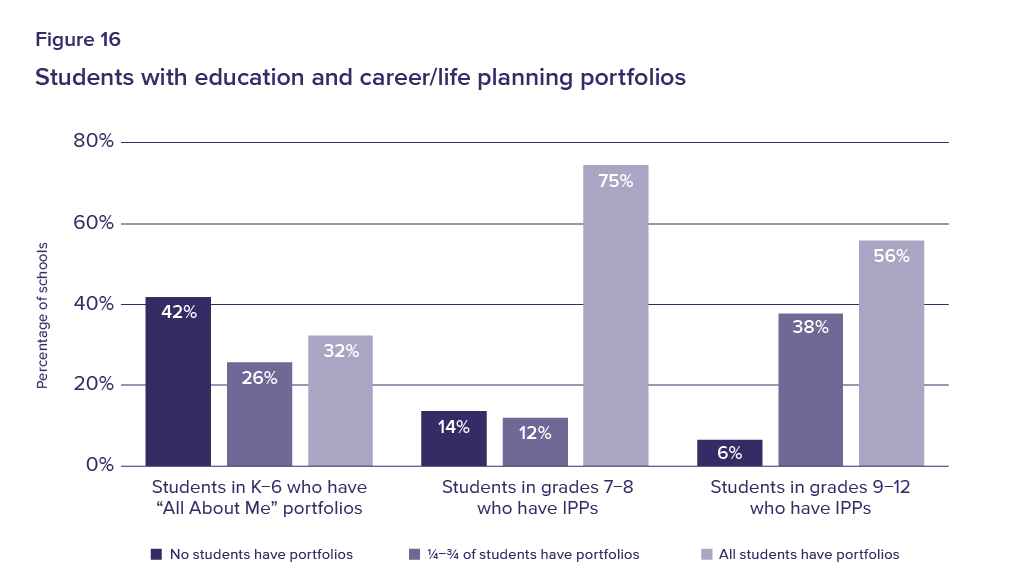
- 34% of elementary and 56% of secondary schools report that every student has an education and career/life planning portfolio.
- 23% of elementary and 40% of secondary schools report professional development on career and life planning is available to their teachers.
- The average ratio of students to guidance counsellors per secondary school is 380 to 1. In 10% of schools, that ratio is as high as 600 to 1.
This is an excerpt from People for Education’s report, Career and life-planning in schools.102
Across Canada, rapid technological, economic, and social change has prompted public education systems to adapt their models for career and life planning. Ontario has committed to developing “an integrated strategy to help the province’s current and future workforce adapt to the demands of a technology-driven knowledge economy…by bridging the worlds of skills development, education and training.”103
In 2013, Ontario introduced Creating Pathways to Success: An Education and Career/Life Planning Program for Ontario Schools. This policy is intended to support students as they transition through school and plan for their futures. It includes a number of mandatory components:104
- portfolios for every student from grade 7 to grade 12;
- career and life planning committees in every school; and
- professional development for teachers.
The goals of Creating Pathways to Success are to:
- allow students to develop the skills and knowledge necessary to be able to make education and career/life choices;
- provide students with opportunities for learning in and out of the classroom; and
- engage parents and the broader community in the development, implementation and evaluation of the program.
Our guidance counsellor is half-time and shared between two schools. It makes it difficult to follow up and support students.
Elementary school, Toronto DSB
Student portfolios
Part of the approach of Creating Pathways to Success is to put students “at the centre of their own learning.”105 It is intended to support students’ capacity for self-discovery and build their self-knowledge.
Student portfolios are an important element of the program. The portfolios track student learning, guide school transitions and course selection, and allow students to reflect on their career and life goals.106
From kindergarten to grade 6, students document their learning in an “All About Me” portfolio. The portfolio contains evidence of their learning in an age-appropriate format (e.g. drawings, self-reflections, handouts).
From grades 7 to 12, students keep track of their learning through mandatory Individual Pathways Plans (IPP). While the “All About Me” portfolio focuses more on self-knowledge, the IPP is intended to be the primary planning tool for choosing courses and exploring post-secondary destinations.107
We are just at the very initial stages with the All About Me and IPPs. There have been software glitches and staff have been asked to use other techniques—not where we would like to be either at the school nor board level.
Elementary school, Algonquin and Lakeshore CDSB
There is more consistent use of IPPs in grades 7 and 8 than there is in secondary school. One the reasons for this, according to principals’ comments, is that the IPPs are seen as useful for supporting transitions to secondary school, including course selection. Principals also said that professional development is available to support teachers in grades 7 and 8 in using web-based planning tools to develop IPPs.
Education and Career/Life Planning Program Advisory Committees
The policy requires every school to have a committee to support career and life planning strategies. The committee must include administrators, teachers, students, parents, and members of the community. In secondary schools, the committee must also include guidance staff.108
Even though they are mandatory, only 15% of elementary and 39% of secondary schools report having Education and Career/Life Planning Program Advisory Committees. It has also been difficult for schools to meet the membership requirements.
In the schools with committees:
- Only 13% of elementary and 8% of secondary schools report having community members on the committee.
- Only 33% of elementary and 12% of secondary schools report that their committees include parents.
More connections [are] required from industry to help give students experiential learning and to see what opportunities wait for them.
Secondary school, Toronto DSB
Professional development for teachers
One of the goals of the Creating Pathways policy is that education and career/life planning is integrated into existing curriculum, from kindergarten to grade 12. To support this integration, Creating Pathways mandates professional development for teachers on all aspects of the education and career/life planning program. However, only 23% of elementary and 40% of secondary schools report that teachers are receiving training.
PD on this has been very limited. Nobody really knows what is expected or what to do regarding ‘All About Me.’
Elementary School, Thames Valley DSB
Schools commented that the lack of access to professional development is a major roadblock to the implementation of the “All About Me” and Individual Pathways Plan portfolios.
The role of guidance counsellors
Guidance counsellors in elementary schools
One of the purposes of the education and career/life planning strategy is to support students as they make transitions—from grade to grade, from elementary to secondary school, and from secondary school to their post-secondary destinations. There is evidence that the transition from elementary to secondary school is particularly challenging for many students.109
Only 17% of elementary schools have guidance counsellors, and the majority are part-time. In elementary schools that include grades 7 and 8—where the more complex IPPs are required—only 23% have guidance counsellors, the majority part-time.
Despite having 600 students in grades 7 and 8, and 900 students in total (6, 7, 8) our Guidance allocation is only 0.5 [FTE]. It’s not enough. We need to put our money where our mouth is and give more support to planning, guidance, and mental health.
Elementary school, Peel DSB
Guidance counsellors in secondary school
Data from the 2017 survey confirm that in the majority (80%) of secondary schools, the guidance counsellor is primarily responsible for helping students create and review Individual Pathways Plans. During grades 11 and 12, semi-annual reviews of IPPs provide an opportunity for students to receive direct guidance from school personnel on crucial course selections and post-secondary planning.110 Guidance counsellors are identified as a key part of this process, but data from the 2017 survey show that 16% of secondary schools do not have a full-time guidance counsellor, and the average ratio of students to guidance counsellors per school is 380 to 1. In 10% of schools, that ratio is as high as 600 to 1.
In 2017:
- 48% of elementary schools and 10% of secondary schools fundraise for learning resources (e.g. computers, classroom supplies, etc.)
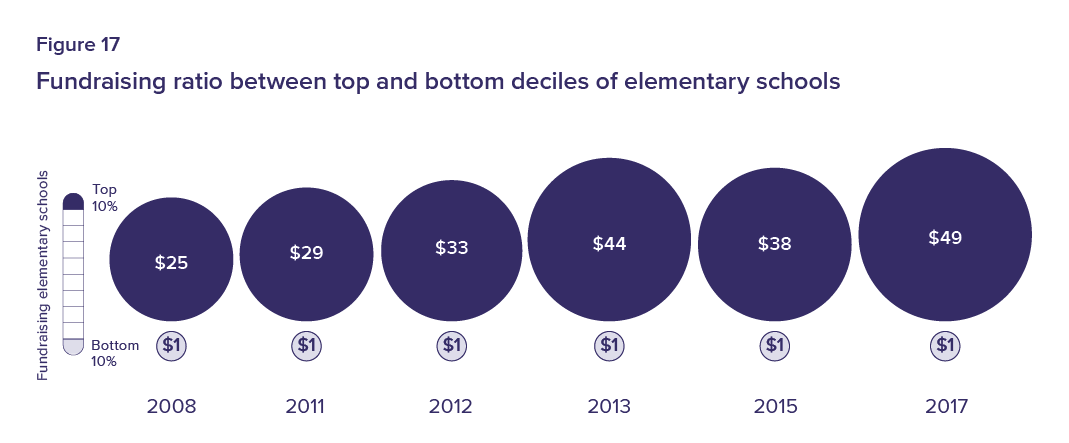
- Among elementary schools, the lowest 10% of fundraising schools raise one dollar for every $49 raised by the top 10% of schools.
- The top 5% of fundraising secondary schools raise as much as the bottom 83% combined.
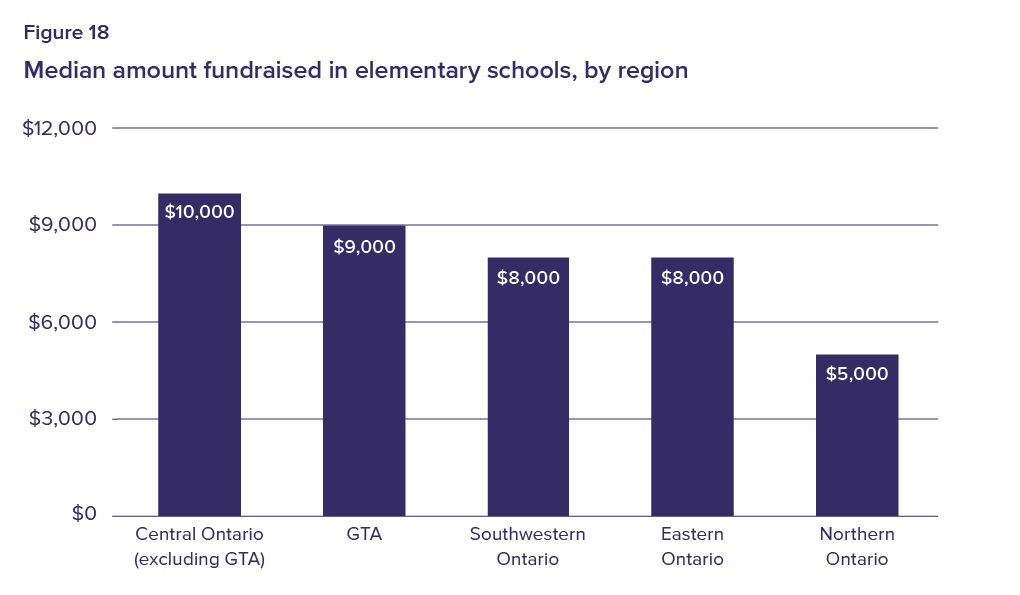
Fundraising is deeply entrenched within Ontario’s public education system. In 2017, 85% of secondary schools and 98% of elementary schools report raising money, but there is large variation in the amount raised by individual schools. While some schools report raising $0, others raise as much as $200,000. A 2013 report by People for Education found a relationship between the amounts schools fundraised and average family incomes.111 These findings, combined with this year’s survey results, raise concerns about the impact of fundraising on equity in the system.
Existing guidelines for fundraising and fees
Ontario has guidelines for both fundraising and the fees that some schools charge.112 The guidelines prohibit the use of private funds to cover the cost of items that “replace public education”113 or are already funded via provincial grants; they also prohibit charging fees for “materials that are required for completion of the curriculum.”114
Despite the guidelines, data from 2017 show that:
- 48% of elementary and 10% of secondary schools fundraise for learning resources
- 18% of elementary and 6% of secondary schools request a fee for learning resources
While 99% of all schools report they provide subsidies for students who cannot pay fees, a survey by the Ontario Student Trustees’ Association found that 36% of secondary students have experienced fees as a barrier to participation.115
The relationship between fundraising and student success
As the gap between schools raising the highest and lowest amounts of money appears to be widening, experts remain uncertain what these fundraising disparities may mean for the province’s schools. One recent study found a small relationship between funds raised and students’ EQAO test scores, concluding that fundraising sums are insignificant compared to funds distributed to schools by the province.116 Others have asserted a stronger relationship between student learning and fundraising, with greatest benefits accruing to a small subset of students within schools.117
Top fundraising schools: widening gaps
Not only is there a wide range in the amounts schools fundraise, but there is also a significant gap between the highest and lowest fundraising schools. In 2017, the top 5% of fundraising secondary schools raised as much as the bottom 83% put together. This gap has persisted for a number of years. In People for Education’s three most recent surveys, the top 10% of fundraising secondary schools have raised more than the bottom 90% of schools.
In elementary schools, the gap between the highest and lowest fundraising schools appears to be widening (see Figure 17). The lowest 10% of fundraising elementary schools raise $1 for every $49 raised by the top 10% of schools, up from $1 to $25 in 2008.
Schools identify inequity
In their survey comments, principals frequently reference fundraising when discussing their schools’ overall successes and challenges. For those with extensive fundraising, many describe tools and resources as a source of pride for their school. One school shared that “fundraising money to build our technology library (laptops, Chromebooks and iPads)”118 was a major success.
We have an active school community, and the parents support events and academics in the school. We have used fundraising money to build our technology library (laptops, Chromebooks and iPads).
Elementary school, Trillium Lakelands DSB
On the other side of the spectrum, many schools identify limited fundraising as an explicit challenge. Comments from these schools indicate that their limited fundraising might be exacerbating the inequities between schools. Rather than pointing to a lack of “extras,” these schools reported that without fundraising, they struggle to provide services that support low-income families. For example, one principal noted that their “breakfast/snack program provides nutrition to many children on a regular basis,” but that “fundraising for this initiative can be challenging.”119 Another shared that they “try to provide clothing for families,” but struggle as they “do not have the fundraising capacity of schools that have parents who are working.”120
Servicing a low socio-economic area makes it challenging to meet the needs of students in all required areas of programming. Nutrition is costly, and fundraising efforts are insignificant. We know that engaging the community in events has a very high impact on our family connection, but these are also costly and there is no funding for these events (food, dancers, etc.).
Elementary school, Lakehead DSB
Fees for enrichment
While fee guidelines restrict charges for core components of education, there are fewer limits on fees for enrichment activities that may have a positive impact on whole child development.
In 2017, 63% of elementary schools and 89% of secondary schools charged fees for extracurricular activities. Recent research found that extracurricular activities are associated with better academic and psychological outcomes, including less substance abuse and delinquency among participants in extracurricular activities.121 In addition, studies have found a correlation between programs that promote physical activity and student health and well-being.122 Charging fees for extracurricular activities may allow certain students the opportunity to develop competencies in broad areas of learning, while leaving other students out.
Early intervention and focused program support for children and youth at risk are solid social and economic investments in this province’s future.
Report of the expert panel on learning opportunities123
Ontario spends approximately $24 billion annually on public education. Almost half of this funding is allocated on a per pupil basis in the Pupil Foundation Grant, which was $10.55 billion for 2016/17 (see Figure 19). The remainder is allocated mainly through a series of Special Purpose Grants, which use socio-demographic and geographic data to assess and address any funding disparities between boards. These Special Purpose Grants are meant to help level the playing field, so that school boards that differ in size, socio-demographic make-up, geography, and access to resources are all able to support their students.
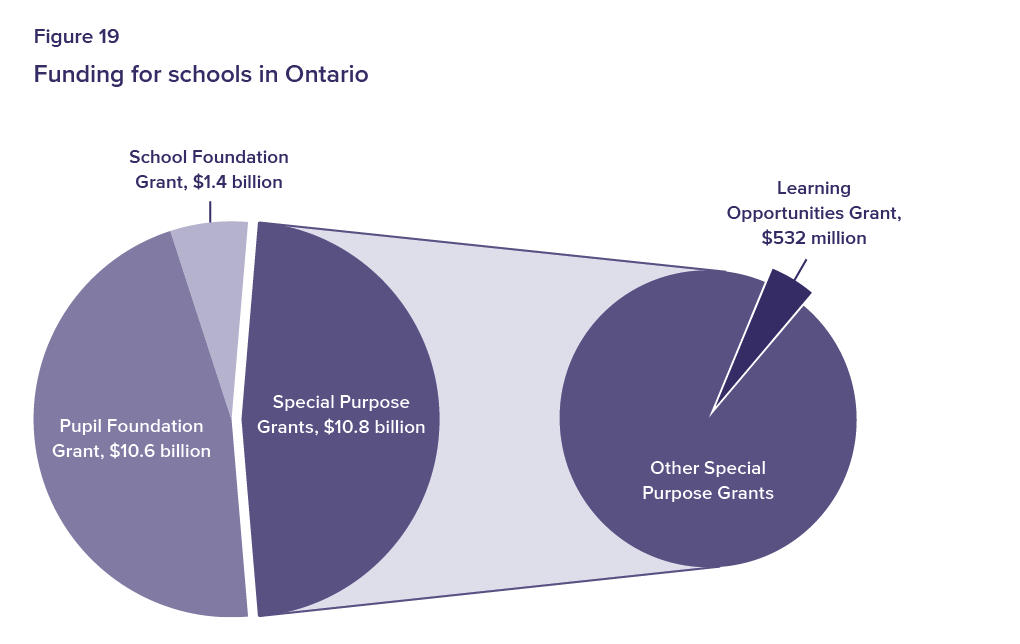
In 2016/17, the Ministry of Education provided $10.78 billion through thirteen Special Purpose Grants—roughly 47% of the total provincial educational funding.124 In this chapter, we examine one of those grants—the Learning Opportunities Grant.
In 1997, when the provincial education funding formula was first developed, the province included a Learning Opportunities Grant (LOG) to provide greater financial assistance to boards with higher proportions of students deemed ‘at-risk’ of academic failure or disengagement.
The funding was intended to support things like early intervention programs, guidance programs, withdrawal for individualized support, parental and community engagement, and opportunities for multi-sector collaboration and partnerships125—all of which were perceived as ways to provide students with an equitable chance for success in education.
The original description of the grant pointed to a number of factors that could determine students’ vulnerability, including, “low family income; an ongoing struggle to meet basic needs for food, shelter and clothing; poor quality nutrition; low parental education levels; single parentage; chronically stressed parents; lack of social support networks; family violence and substance abuse; dilapidated and overcrowded housing; limited recreational and sports opportunities; fear of violence at school or in the community; proximity to sub-cultures of crime; traumatized refugee backgrounds; a poor outlook for jobs and the future.”126
The LOG not only provided a way to support early intervention and create targeted programming for children and youth deemed at-risk, but it also positioned redistributive equity as an important educational, social, and economic investment.127
Funding local solutions
To ensure that the LOG was effective, the Ministry of Education appointed an expert panel in 1997 to provide advice on funding and programs to support students who may be at risk of struggling in school.
The panel advised the Ministry to provide funding for a “diversity of local solutions.”128 These solutions could include things like “lower pupil/teacher ratios, teacher aides, tutors, counsellors, social workers assessment, augmented literacy and numeracy programming, expanded kindergarten, intensified remedial reading programs, adapted curriculum, computer-aided instruction, summer school, before- and after-school programs, homework help, recreation and sports activities, orientation and life skills, mentoring, private sector partnerships, breakfast/lunch programs, excursions, field trips, arts and cultural programs, extra-curricular activities, parenting classes, home/school linkages, and stay-in-school and school re-entry programs.”129
The expert panel recommended four demographic variables to be used in determining eligibility for funds: “poverty, parental education, refugee status, and aboriginal status.”130 They also recommended that the LOG be set at $400 million, and used specifically on programs and services for students deemed to be at-risk.131
When the LOG was first implemented in 1998, the grant was distributed based on demographics, as recommended by the expert panel. However, the amount of funding was set at $185 million, instead of the approximately $400 million recommended by the panel.132
Funding remains below 1997 recommendations
Since 1998, the demographic allocation in the LOG has increased fairly steadily. However, it is still substantially below the $400 million recommended in 1997. If kept at the rate of inflation, according to the Bank of Canada inflation calculator,133 the demographic allocation for the LOG should have been approximately $564.2 million for the 2016/17 funding year, but it was only $353 million.134
Proportional decrease in demographic allocation
Not only is the demographic portion of the LOG well below the funding level recommended in 1997, but it has also steadily decreased in proportion to the total LOG funding.
In 2000/01, the Ministry of Education began adding new programs to the LOG, targeted more closely to literacy and numeracy. These programs are for all of Ontario’s 2 million students, not only those whose socio-economic status may put them at risk. As the funding for these new programs was added, the proportion of funding based on boards’ demographics was reduced.135
New programs and initiatives added to the LOG include:
- Literacy and Math Outside the School Day
- Student Success, Grades 7 to 12
- School Effectiveness Framework
- Ontario Focused Intervention Partnership (OFIP) Tutoring
- Specialist High Skills Major
- Mental Health Leaders
- Outdoor Education
- Library Staff
- School Authorities Amalgamation
The allocations focused on literacy and numeracy have not only increased in proportion to the overall LOG funding, but they also appear to be deviating from the original intent of the grant (redistributive equity) by focusing more on performance-driven initiatives. By continuing to reduce the demographic portion of the LOG, it is more difficult for school boards to provide resources such as before- and after-school care, summer school, extra-curricular activities, art and cultural events.
Table 3 includes all the changes to the LOG funding over the past decade. In 2006/07, 82% of the LOG funds were reserved for the Demographic Allocation.136 However, by 2010/11, the Demographic Allocation had dropped to 74% of total LOG funding,137 and is now projected to include only 47% of total LOG funding for 2017/18 (see Figure 20).138
Table 3
Breakdown of LOG funding
Year |
Demographic Allocation (millions)139 |
% of LOG140 |
Other LOG Allocations (millions) |
% of LOG |
Total LOG (millions)141 |
| 2006/07142 | $321.8 | 82% | $68.8 | 18% | $390.6 |
| 2007/08143 | $332.1 | 82% | $72.4 | 18% | $404.5 |
| 2008/09144 | $340.8 | 82% | $72.8 | 18% | $413.6 |
| 2009/10145 | $338.6 | 82% | $75.9 | 18% | $414.5 |
| 2010/11146 | $340.1 | 74% | $120.2 | 26% | $460.3 |
| 2011/12147 | $351.2 | 74% | $125.1 | 26% | $476.3 |
| 2012/13148 | $348.7 | 71% | $145.4 | 29% | $494.1 |
| 2013/14149 | $346.4 | 71% | $144.1 | 29% | $490.5 |
| 2014/15150 | $350.4 | 69% | $154.8 | 31% | $505.2 |
| 2015/16151 | $349.9 | 69% | $154.7 | 31% | $504.6 |
| 2016/17152 | $353.0 | 66% | $179.1 | 34% | $532.1 |
| 2017/18153 | $358.2 | 47% | $401.1 | 53% | $759.2 |
Enveloping funding—micromanagement or protection for students at risk?
In 2014, the Ministry of Education released Achieving Excellence: A Renewed Vision for Education in Ontario. In its consultations to develop the vision, the Ministry requested input on “earmarking or enveloping funds for specific purposes.”154 When funds are enveloped—as is the case with special education—they can only be spent for the specified purpose. Most education funding is not enveloped, and it is ultimately up to boards to choose where to spend it.
According to the Ministry, two perspectives emerged from the consultations. Their report says, “Many participants felt that enveloping encouraged silos, stifled innovation and created the risk of spending unnecessarily in one area while having to skimp on another. School boards, in particular, expressed these concerns.”155 Conversely, others said that, “some controls of this nature were needed to ensure key principles of the education system, for example, equity and stewardship of resources, were supported.”156
In its 1997 report, the expert panel had recommended protecting the funding in what was then a demographically based LOG. Instead, in 2016/17, the Ministry of Education enveloped eight components within the LOG into a “Student Achievement Envelope.”157 This funding must be spent in the areas it describes. The demographic portion of the LOG has no similar requirements; it can be spent in any way a board chooses.
Evaluating impacts
Since 1997, a range of advisors have recommended that the province do more to evaluate the impact of the LOG grant. The initial expert panel recommended instituting processes for accountability and reporting on how funding was being used. The panel also recommended that “all programs should ultimately be evaluated in terms of the results they have achieved for students.”158 This sentiment was echoed in the 2002 Education Equality Task Force report, which recommended “collecting and analyzing data on programs and services for students at risk from a representative sample of school boards… to determine the appropriate funding magnitude for the LOG.” The report suggested that greater attention be paid to the correlation between funding, student achievement and the reduction of the achievement gap.159
Unless cited from other sources, the statistics and quoted material in this report originate from People for Education’s 20th Annual Survey (2016/17) of Ontario’s elementary schools, and 17th Annual Survey of Ontario’s secondary schools. Surveys were mailed to principals in every publicly funded school in Ontario in the fall of 2016. Surveys could also be completed online in English and French.
This year, we received 1,101 responses from elementary and secondary schools in 71 of Ontario’s 72 publicly funded school boards, representing 22% of the province’s publicly funded schools. Survey responses are also disaggregated to examine survey representation across provincial regions (see Table 5). Although regional representation in this year’s survey corresponds relatively well with the regional distribution of Ontario’s schools, schools located in the North region showed the largest discrepancy, being overrepresented in the survey by five percentage points.
Table 5
Survey representation by region
Region (sorted by postal code) |
% of schools in survey |
% of schools in Ontario |
| Eastern (K) | 20% | 18% |
| Central (L exclud. GTA) | 14% | 17% |
| Southwest (N) | 17% | 20% |
| North (P) | 16% | 11% |
| GTA | 33% | 34% |
For other geographic comparisons, schools were classified as either small town/rural or urban/suburban using postal codes. Small town/rural schools are located in jurisdictions with under 75,000 people and not contiguous to an urban centre greater than 75,000 people. All other schools were classified as urban/suburban schools. Based on scholarly literature and governmental sources, it was determined that a population of 75,000 persons provided the most accurate dividing line between small town/rural and urban/suburban areas in the Ontario provincial context.
Data analysis and reporting
Qualitative data analysis was conducted using inductive analysis. Two researchers independently read and looked for emergent themes in each set of data (i.e. the responses to each of the surveys open-ended questions). The researchers then compared their themes and discussed commonalities. Both researchers agreed upon the final emergent themes.
The quantitative analyses in this report are based on both descriptive and inferential statistics. The chief objective of the descriptive analyses is to present numerical information in an illuminating format that is accessible to a broad public readership. All data were analyzed using SPSS statistical software.
Calculations have been rounded to the nearest whole number and may not amount to 100% in displays of disaggregated categories. The average student to staff ratio was calculated for schools that reported both the total number of students and the full-time equivalents for staff positions. All survey responses and data are kept confidential and stored in conjunction with Tri-Council recommendations for the safeguarding of data.
- Joseph Murphy et al., “Academic Press: Translating High Expectations into School Policies and Classroom Practices,” Educational Leadership 40 (December 1982): 22-7.
- Jonathan Cohen et al., “School Climate: Research, Policy, Practice, and Teacher Education” Teachers College Record 111, no. 1 (2009): 180-213.
- Ontario Ministry of Education, Education Funding: Technical Paper, 2016-17 (Toronto, ON: Government of Ontario, 2016), 18.
- Ibid., 18-23.
- In this document we will use the term “psychologist” to include registered psychologists and registered psychological associates, as well as supervised non-registered psychology service providers in schools.
- Comment from the 2016/17 survey, secondary school, Limestone DSB.
- Government of Ontario, Open Minds, Healthy Minds: Ontario’s Comprehensive Mental Health and Addictions Strategy (Toronto, ON: Queen’s Printer for Ontario, June 2011).
- Ibid., 8.
- Ibid., 14.
- Ontario Ministry of Education, Education Funding: Technical Paper, 2016-17 , 68.
- Donald H. Saklofske et al., “School Psychology in Canada: Past, Present, and Future Perspectives,” in School Psychology: Past, Present, and Future, ed. Thomas K. Fagan and Paula Sachs Wise (Bethesda, MD: National Association of School Psychologists, 2007), 297-338.
- Jan Kasperski, Issue Brief: Psychology in Education , (Toronto, ON: Ontario Psychology Association, April, 2016).
- Ibid.
- Maria Kokai and Debra Lean, Response to People for Education Reports Regarding Access to Psychological Services, Guidance Services and De-streaming Grade 9 , (letter, Toronto: ON, October 26, 2015).
- Ibid., 3–4.
- This quote has been translated from French. Original quote: “Il est possible de voir les progrès chez les élèves qui reçoivent des services de façon régulière. Par contre, les sessions en orthophonie par exemple, sont données en bloc. Une fois le bloc terminé, aucun soutien pour continuer, même si les buts de sont pas atteints. Plusieurs parents ont des services à l’externe dont nous ne sommes pas nécessairement au courant. La travailleuse sociale ne vient pas à l’école à moins que nous ayons des cas. Je crois que l’on devrait, à ce moment, donner aux enfants des sessions de prévention au lieu d’intervenir lorsque tout le monde est en état de choque, en crise ou autre et qu’ils ne veulent pas recevoir de services puisqu’ils ne voient pas clair.”
- This quote has been translated from French. Original quote: “Notre orthophoniste est à quatre heures de route de notre communauté donc les services locaux, si on n’est plus sur la liste d’attente, provient d’un organisme anglophone externe.”
- Glenda L. Black et al., “Evaluation of a Family and Community Engagement Strategy in Three Ontario Communities,” Alberta Journal of Educational Research 59, no. 4 (2014): 569-90; Martin J. Blank, Atelia Melaville, and Bela P. Shah, Making the Difference: Research and Practice in Community Schools . (Washington, DC: Coalition for Community Schools, Institute for Educational Leadership, May 2003).
- Ontario Ministry of Education, Education Funding: Technical Paper, 2016-17 , 112 .
- This quote has been translated from French. Original quote: “Notre école ouvre ses portes et accueille toute la communauté en général, et non seulement notre communauté scolaire.”
- Premier’s Community Hub Framework Advisory Group, Community Hubs in Ontario: A Strategic Framework and Action Plan (Toronto, ON: Government of Ontario, 2016).
- Ibid., 34.
- Government of Ontario, “News Release—Ontario Helping More Schools Become Community Hubs—Province Investing in Schools to Better Serve Communities,” Government of Ontario Newsroom (Toronto, ON: Government of Ontario, May 6, 2016).
- Premier’s Community Hub Framework Advisory Group, Community Hubs , 7.
- Canadian Library Association, Leading Learning: Standards of Practice for School Library Learning Commons in Canada (Ottawa, ON: Canadian Library Association, 2014), 4-7; Ontario School Library Association, Together for Learning: School Libraries and the Emergence of the Learning Commons (Toronto, ON: Ontario School Library Association, 2010), 3-5.
- Canadian Library Association, Leading Learning , 10 .
- Marlene Asselin, Jennifer L. Branch, and Dianne Oberg, Achieving Information Literacy: Standards for School Library Programs in Canada (Ottawa, ON: Canadian Association for School Libraries, 2003), 22.
- Ontario Ministry of Education, The Ontario Curriculum: Social Studies (Grades 1-6), History and Geography (Grades 7 and 8) (Toronto, ON: Queen’s Printer for Ontario, 2013).
- People for Education, Reading for Joy (Toronto, ON: People for Education, 2011).
- Ontario Ministry of Education, Education Funding: Technical Paper, 2016-17 .
- “Do students today read for pleasure?” PISA in Focus (OECD, September 2011).
- People for Education, Reading for Joy .
- Dianne Oberg, Ignoring the Evidence: Another Decade of Decline for School Libraries (Toronto, ON: Canadian Education Association, 2015).
- EQAO, Contextual Information (Toronto, ON: EQAO, 2016), 10-11.
- Ontario Ministry of Education, The Ontario Curriculum: The Arts (Grades 1-8) (Toronto, ON: Queen’s Printer for Ontario, 2009), 6.
- Rena Upitis, “Creativity: The State of the Domain,” Measuring What Matters (Toronto, ON: People for Education, November 8, 2014), 3.
- Michael Fullan and Maria Langworthy, A Rich Seam: How New Pedagogies Find Deep Learning (London, UK: Pearson, 2014); Ontario Ministry of Education, 21st Century Competencies: Foundation Document for Discussion (Toronto, ON: Queen’s Printer for Ontario, 2015); OECD, PISA 2012 Results: Creative Problem Solving: Students’ Skills in Tackling Real-Life Problems (Volume V) (Paris, FR: OECD Publishing, 2014).
- “O. Reg. 274/12: Hiring Practices,” Education Act, R.S.O. 1990, c. E.2 (Toronto, ON: Queen’s Printer for Ontario, 2016).
- People for Education, Annual Report on Ontario’s Publicly Funded Schools 2013 (Toronto, ON: People for Education, 2013), 18.
- Ibid., 17.
- National Centre for Chronic Disease Prevention and Health Promotion, Health and Academic Achievement (Atlanta, GA: Centers for Disease Control and Prevention, 2014).
- “Purpose,” Education Act, R.S.O. 1990, c. E.2 (Toronto, ON: Queen’s Printer for Ontario, 1990).
- Manitoba has Physical Education/Health Education, Quebec has Physical Education and Health, and British Columbia and Yukon have Physical and Health Education, but the other provinces currently treat Physical Education independently.
- Ontario Ministry of Education, The Ontario Curriculum: Health and Physical Education (Grades 1—8) (Toronto, ON: Queen’s Printer for Ontario, 2015) 22-39.
- UNESCO, Quality Physical Education: Guidelines for Policy Makers (Paris, FR: UNESCO, 2015), 50.
- Richard Bailey, “Physical Education and Sport in Schools: A Review of Benefits and Outcomes,” Journal of School Health 76, no. 8 (2006): 397-401; Richard D. Telford et al., “Physical Education, Obesity, and Academic Achievement: A 2-year Longitudinal Investigation of Australian Elementary School Children,” American Journal of Public Health 102, no. 2 (2012): 368-74.
- Guy E. J. Faulkner et al., “Specialist or Nonspecialist Physical Education Teachers in Ontario Elementary Schools: Examining Differences in Opportunities for Physical Activity,” The Alberta Journal of Educational Research 54, no. 4 (2008): 407-19.
- “School Health and Youth Health Promotion,” World Health Organization , accessed February 16, 2017.
- See school improvement plans, school board improvement plans, and union and association position statements for more information on how schools have long been engaged in addressing the well-being of students and staff wellness.
- Ontario Ministry of Education, Achieving Excellence: A Renewed Vision for Education in Ontario (Toronto, ON: Queen’s Printer for Ontario, 2014), 3.
- Ontario Ministry of Education, Ontario’s Well-Being Strategy For Education: Discussion Document (Toronto, ON: Queen’s Printer for Ontario, 2016).
- Ibid., 3.
- “School Health and Youth Health Promotion,” World Health Organization .
- “Interpretation and Other General Matters,” Education Act, R.S.O. 1990, c. E.2 (Toronto, ON: Queen’s Printer for Ontario, 1990).
- Ontario Ministry of Education, Education Funding: Technical Paper, 2016-17 , 15.
- Ibid. , 34.
- Ibid. , 34-8.
- Ontario Ministry of Education, 2016-17 Education Funding: A Guide to the Special Education Grant (Toronto, ON: Queen’s Printer for Ontario, 2016), 7.
- Ontario Ministry of Education, Standards for School Boards’ Special Education Plans . (Toronto, ON: Government of Ontario, 2000), 6-7.
- Ontario Ministry of Education, 2016-17 Education Funding: A Guide to the Special Education Grant , 3.
- This number was calculated using the mean number of students waiting for assessment, IPRC, or placement per elementary school and the total number of elementary schools in Ontario according to the October 2016 submission of the Ontario School Information System.
- People for Education has collected data about restrictions of the number of students that can be assessed each year since 2012.
- Ontario Ministry of Education, Education Funding: Technical Paper, 2016-17 , 20-3.
- This quote has been translated from French. Original quote: “Sensibiliser les élèves à cette culture bien vivante dans l’esprit de la grande réconciliation de l’engagement du Canada envers ses communautés autochtones.”
- Government of Ontario, “News Release—Ontario Proclaims First Week of November Treaties Recognition Week—Province Working with Indigenous Partners to Build Awareness,” Government of Ontario Newsroom (Toronto, ON: Government of Ontario, May 30, 2016).
- Truth and Reconciliation Commission of Canada, Honouring the Truth, Reconciling for the Future: Summary of the Final Report of the Truth of Reconciliation Commission of Canada (Winnipeg, MB: National Centre for Truth and Reconciliation—University of Manitoba, 2015), 319-37.
- Government of Ontario, The Journey Together: Ontario’s Commitment to Reconciliation with Indigenous Peoples (Toronto, ON: Queen’s Printer for Ontario, 2016).
- Kelly Gallagher-Mackay, Annie Kidder, and Suzanne Methot, First Nations, Métis and Inuit Education: Overcoming Gaps in Provincially Funded Schools (Toronto, ON: People for Education, 2013).
- Ontario Ministry of Education, Ontario First Nation, Métis, and Inuit Education Policy Framework (Toronto, ON: Queen’s Printer for Ontario, 2007).
- Ibid., 22.
- Ibid., 21.
- Joseph Brean, “Ontario School Board Tosses Shakespeare for Indigenous Writers,” National Post (Toronto, ON), May 11, 2017.
- “Acknowledgment of Traditional Lands and Territories,” Toronto District School Board , accessed May 2, 2017.
- Truth and Reconciliation Commission of Canada, “Education for Reconciliation,” Truth and Reconciliation Commission of Canada: Calls to Action (Winnipeg, MB: National Centre for Truth and Reconciliation—University of Manitoba, 2015), 7.
- Government of Ontario, The Journey Together , 19.
- Angela Nardozi and Angela Mashford-Pringle, “Engaging Teacher Candidates about Aboriginal Education Perspectives in Ontario,” First Nations Perspectives 6, no. 1 (2014): 52-66.
- Rhonda G. Craven, Alexander S. Yeung, and Feifei Han, “The Impact of Professional Development and Indigenous Education Officers on Australian Teachers’ Indigenous Teaching and Learning,” Australian Journal of Teacher Education 39, no. 8 (2014): 85-108.
- Ontario Ministry of Education, Implementation Plan: Ontario First Nations, Métis, and Inuit Education Policy Framework , (Toronto, ON: Queen’s Printer for Ontario, 2014), 16.
- Statistics Canada, “Secondary (High) School Diploma or Equivalent (14), Labour Force Status (8), Aboriginal Identity (8), Area of Residence: On Reserve (3), Registered or Treaty Indian Status (3), Age Groups (13B) and Sex (3) for the Population Aged 15 Years and Over, in Private Households of Canada, Provinces and Territories, 2011 National Household Survey,” 2011 National Household Survey: Data tables (table), Statistics Canada Catalogue no. 99-012-X2011044 (Ottawa, ON: Statistics Canada, February 14, 2017).
- Ontario Ministry of Education, Implementation Plan: Ontario First Nations, Métis, and Inuit Education Policy Framework , 16.
- Pamela Toulouse, Beyond Shadows: First Nations, Métis and Inuit Student Success , (Ottawa, ON: Canadian Teachers’ Federation, 2013).
- Pamela Toulouse, What Matters in Indigenous Education: Implementing a Vision Dedicated to Holism, Diversity and Engagement (Toronto, ON: People for Education, 2016).
- Susan D. Dion, Krista Johnson, and Carla M. Rice, Decolonizing Our Schools, Aboriginal Education In The Toronto District School Board: A Report on the Urban Aboriginal Education Pilot Project (Toronto, ON: York University, September 30, 2010) .
- In 2017/18, the First Nation, Métis, and Inuit Studies Allocation was renamed the Indigenous Studies Allocation, and reduced the allocation per pupil credit to $1,153.48. For more information, please see the 2017/18 Education Funding Technical Paper. Ontario Ministry of Education, Education Funding: Technical Paper, 2017/18 (Toronto, ON: Government of Ontario, 2017), 52.
- Ontario Ministry of Education, The Ontario Curriculum, Grades 9-12: Course Descriptions and Prerequisites (Toronto, ON: Queen’s Printer for Ontario, 2011), 84
- Ontario Ministry of Education, Education Funding: Technical Paper, 2016-17 , 48.
- Bruce Peninsula District School, 2017-2018 Course Calendar , accessed May 1, 2017, B-41.
- Ontario Ministry of Education, Education Funding: Technical Paper, 2016-17 , 46.
- In 2017-18, the ministry has sweatered the Per pupil Amount of the Indigenous Education Grant, meaning the $25.3 million in the Per Pupil Amount must be spent by boards on a dedicated Indigenous Education Lead, and remaining funds on the implementation of the Ontario First Nation, Métis, and Inuit Education Policy Framework. For more information, please see Ontario Ministry of Education, Education Funding: Technical Paper, 2017-18 , 50-1.
- Office of the Auditor General of Ontario, “Chapter 3: Follow-Up on Reports Issued by the Standing Committee on Public Accounts (Summary),” 2016 Annual Report Volume 2 (Toronto, ON: Queen’s Printer for Ontario, 2016), 221-5.
- Statistics Canada, 2011 National Household Survey Highlights: Factsheet 1 (Ottawa, ON: Statistics Canada, June, 2013).
- Statistics Canada, “Detailed Language Spoken Most Often at Home (103), Other Languages Spoken Regularly at Home (9), Generation Status (4), and Sex (3) for the Population 15 Years and Over of Canada, Provinces, Territories, Census Divisions and Census Subdivisions, 2006 Census—20% Sample Data,” 2006 Census Topic-based tabulations (table), Statistics Canada Catalogue no. 97-555-XCB2006038 (Ottawa, ON: Statistics Canada, July 17, 2006).
- Statistics Canada, 2011 Census Profile: Language (Ottawa, ON: Statistics Canada, May 31, 2016).
- “Innovative Programs and Services,” Éducation en langue française en Ontario , accessed March 2, 2017; Ontario Ministry of Education, English Language Learners, ESL and ELD Programs and Services: Policies and Procedures for Ontario Elementary and Secondary Schools, Kindergarten to Grade 12 (Toronto, ON: Queen’s Printer for Ontario, 2007), 22.
- Ontario Ministry of Education, Education Funding: Technical Paper, 2016-17 , 40-1.
- Feng Hou and Qi Zhang, “Table 2: Parental education and student aspiration by immigration status and province or region, 2003 to 2012,” (table) Regional Differences in the Educational Outcomes of Young Immigrants , Statistics Canada Catalogue no. 75-006-X (Ottawa, ON: Statistics Canada, November 18, 2015), 3.
- OECD, Helping Immigrant Students to Succeed at School—And Beyond (Paris, FR: OECD, 2015).
- Feng Hou and Aneta Bonikowska, “Table 3: Educational and labour market outcomes for childhood immigrants 25 to 44 years of age, by admission class,” (table) Educational and Labour Market Outcomes of Childhood Immigrants by Admission Class , Statistics Canada Catalogue no. 11F0019M — No. 377 (Ottawa, ON: Statistics Canada, April 25, 2016), 18.
- Ontario Ministry of Education, English Language Learners, ESL and ELD Programs and Services , 18.
- Ontario Ministry of Education, Education Funding: Technical Paper, 2016-17 , 40.
- This quote has been translated from French. Original quote: “Le programme ALF aide énormément au développement de la langue française. Il est essentiel de le faire au début de leur cheminement de l’apprentissage.”
- Katie Peterson and Daniel Hamlin, Career and Life Planning in Schools: Multiple Paths; Multiple Policies; Multiple Challenges (Toronto, ON: People for Education, March 1, 2017).
- The Premier’s Highly Skilled Workforce Expert Panel, Building the Workforce of Tomorrow: A Shared Responsibility (Toronto, ON: Queen’s Printer for Ontario, 2016).
- In January, 2017 the Ministry of Education amended this policy, removing the mandatory requirement for “All About Me” portfolios for students in grades 1 to 6.
- Ontario Ministry of Education, Creating Pathways to Success: An Education and Career/Life Planning Program for Ontario Schools (Toronto, ON: Queen’s Printer, 2013), 7.
- Ibid., 17-9.
- Ibid., 17-9.
- Ibid., 41.
- Daniel Hamlin, David Hagen Cameron, and Elyse Watkins, Ontario’s Guidance Counsellors: Spread Thinly in an Environment of Growing Expectations (Toronto, ON: People for Education, March 7, 2016).
- Ibid., 4.
- People for Education, “Fees and Fundraising,” Annual Report on Ontario’s Publicly Funded Schools 2013 (Toronto, ON: People for Education, 2013), 8-11.
- Ontario Ministry of Education, Fees for Learning Materials and Activities Guideline (Toronto, ON: Government of Ontario, 2011); Ontario Ministry of Education, Guideline for School Fundraising (Toronto, ON: Government of Ontario, 2012).
- Ontario Ministry of Education, Guideline for School Fundraising, 1.
- Ontario Ministry of Education, Fees for Learning Materials and Activities Guideline , 3.
- Ontario Student Trustees’ Association (OSTA), OSTA-AECO Student and Parent Survey—Analysis and Results (Toronto, ON: OSTA, People for Education, Student Vote, and ScholarshipsCanada.ca, October 21, 2011).
- Huijie Guo and David R. Johnson, Unfair Advantage? School Fundraising Capabilities and Student Results (Toronto, ON: C.D. Howe Institute, 2017).
- Vana Pistiolis The Results and Implications of Fundraising in Elementary Public Schools: Interviews with Ontario Principals (Doctoral dissertation, University of Toronto, 2012).
- Comment from the 2016/17 survey, elementary school, Trillium Lakelands DSB
- Comment from the 2016/17 survey, elementary school, Peel DSB.
- Comment from the 2016/17 survey, elementary school, Waterloo Region DSB.
- Amy F. Feldman and Jennifer L. Matjasko, “The Role of School-Based Extracurricular Activities in Adolescent Development: A Comprehensive Review and Future Directions,” Review of Educational Research 75, no. 2 (2005): 159-210; Amy Feldman Farb and Jennifer L. Matjasko, “Recent Advances in Research on School-Based Extracurricular Activities and Adolescent Development,” Developmental Review 32, no. 1 (2012): 1-48.
- Bruce Ferguson and Keith Power, “Broader Measures of Success: Physical and Mental Health in Schools,” Measuring What Matters (Toronto, ON: People for Education, November 8, 2014), 6-7.
- Expert Panel on the Learning Opportunities Grant, Learning Opportunities Grant: Panel Report to Minister of Education and Training (Toronto, ON: Government of Ontario, 1997), 4.
- Ontario Ministry of Education, Education Funding: Technical Paper, 2016-17 , 16.
- Expert Panel on the Learning Opportunities Grant, Learning Opportunities Grant .
- Ibid. , 4.
- Ibid. , 4.
- Ibid. , 8.
- Ibid. , 8.
- Ibid. , 7.
- Hugh MacKenzie, Turning Point? Time to Renovate Ontario’s Education Funding Formula (Ottawa, ON: Canadian Centre for Policy Alternatives, 2006).
- People for Education, Public Education in Ontario’s Cities (Toronto, ON: People for Education, 2005), 15.
- “Inflation Calculator,” Bank of Canada , accessed March 30, 2017.
- Ontario Ministry of Education, Education Funding: Technical Paper, 2016-17 , 62 .
- Norbert Hartmann, Overview of Student-Focused Funding in 2000-01 (Memorandum to Directors of Education, March 9, 2000); Ontario Ministry of Education, Education Funding: Technical Paper, 2005-06 (Toronto, ON: Government of Ontario, 2005), 55.
- Ontario Ministry of Education, Education Funding: Technical Paper, 2006-07 (Toronto, ON: Government of Ontario, 2006), 49 .
- Ontario Ministry of Education, Education Funding: Technical Paper, 2010-11 (Toronto: ON, Government of Ontario, 2010), 61.
- Ontario Ministry of Education, Education Funding: Technical Paper, 2017-18 , 63.
- Demographic Allocation values were drawn from each individual education funding technical report released by the Ministry of Education of Ontario and are projected values as per the reporting year. Figures are rounded.
- All percentages are calculated from identified values.
- Total LOG amounts were drawn from individual annual education funding technical report released by the Ministry of Education of Ontario and are projections. Actual total amounts will slightly differ from those reported here. However, to conduct the analysis on the projected demographic allocations, overall projected LOG values were employed. Figures are rounded.
- Ontario Ministry of Education, Education Funding: Technical Paper, 2006-07 .
- Ontario Ministry of Education, Education Funding: Technical Paper, 2007-08 (Toronto, ON: Government of Ontario, 2007).
- Ontario Ministry of Education, Education Funding: Technical Paper, 2008-09 (Toronto, ON: Government of Ontario, 2008).
- Ontario Ministry of Education, Education Funding: Technical Paper, 2009-10 (Toronto, ON: Government of Ontario, 2009).
- Ontario Ministry of Education, Education Funding: Technical Paper, 2010-11 .
- Ontario Ministry of Education, Education Funding: Technical Paper, 2011-12 (Toronto, ON: Government of Ontario, 2011).
- Ontario Ministry of Education, Education Funding: Technical Paper, 2012-13 (Toronto, ON: Government of Ontario, 2012).
- Ontario Ministry of Education, Education Funding: Technical Paper, 2013-14 , (Toronto, ON: Government of Ontario, 2013).
- Ontario Ministry of Education, Education Funding: Technical Paper, 2014-15 , (Toronto, ON: Government of Ontario, 2014).
- Ontario Ministry of Education, Education Funding: Technical Paper, 2015-16 , (Toronto, ON: Government of Ontario, 2015).
- Ontario Ministry of Education, Education Funding: Technical Paper , 2016-17.
- Ontario Ministry of Education, Education Funding: Technical Paper, 2017-18 .
- Ontario Ministry of Education, 2015-16 Education Funding: Consultation Summary (Toronto, ON: Government of Ontario, 2015), 16.
- Ibid., 16.
- Ibid., 16.
- The six enveloped components are the Literacy and Math Outside the School Day Allocation, the Students Success, Grades 7 to 12 Allocation, the Grade 7 and 8 Literacy and Numeracy and Student Success Teachers Allocation, the School Effectiveness Framework Allocation, the Ontario Focused Intervention Partnership (OFIP) Tutoring Allocation, the Specialist High Skills Major (SHSM) Allocation, the Outdoor Education Allocation, and the Library Staff Allocation. For more information, please see Ontario Ministry of Education, Education Funding: Technical Paper, 2016-17 .
- Expert Panel on the Learning Opportunities Grant, Learning Opportunities Grant , 12.
- Mordechai Rozanski, Investing in public education: Advancing the goal of continuous improvement in student learning and achievement; Report of the Education Equality Task Force (Toronto, ON: Queen’s Printer for Ontario, 2002).
“Acknowledgment of Traditional Lands and Territories.” Toronto District School Board. Accessed May 2, 2017.
Asselin, Marlene, Jennifer L. Branch, and Dianne Oberg. Achieving Information Literacy: Standards for School Library Programs in Canada. Ottawa, ON: Canadian Association for School Libraries, 2003.
Bailey, Richard. “Physical Education and Sport in Schools: A Review of Benefits and Outcomes.” Journal of School Health 76, no. 8 (2006): 397-401.
Black, Glenda L., Maria Cantalini-Williams, Susan E. Elliott-Johns, and Ron Wideman. “Evaluation of a Family and Community Engagement Strategy in Three Ontario Communities.” Alberta Journal of Educational Research 59, no. 4 (2014): 569-90.
Blank, Martin J., Atelia Melaville, and Bela P. Shah. Making the Difference: Research and Practice in Community Schools. Washington, DC: Coalition for Community Schools, Institute for Educational Leadership, May 2003.
Brean, Joseph. “Ontario School Board Tosses Shakespeare for Indigenous Writers.” National Post (Toronto, ON), May 11, 2017.
Bruce Peninsula District School. 2017-2018 Course Calendar. Accessed May 1, 2017.
Canadian Library Association. Leading Learning: Standards of Practice for School Library Learning Commons in Canada. Ottawa, ON: Canadian Library Association, 2014.
Cohen, Jonathan, Libby McCabe, Nicholas M. Michelli, and Terry Pickeral. “School Climate: Research, Policy, Practice, and Teacher Education.” Teachers College Record 111, no. 1 (2009): 180-213.
Craven, Rhonda G., Alexander S. Yeung, and Feifei Han. “The Impact of Professional Development and Indigenous Education Officers on Australian Teachers’ Indigenous Teaching and Learning.” Australian Journal of Teacher Education 39, no. 8 (2014): 85-108.
Dion, Susan D., Krista Johnson, and Carla M. Rice. Decolonizing Our Schools, Aboriginal Education In The Toronto District School Board: A Report on the Urban Aboriginal Education Pilot Project. Toronto, ON: York University, September 30, 2010.
“Do Students Today Read for Pleasure?” PISA in Focus. Organization for Economic Cooperation and Development, September 2011.
Education Act, R.S.O. 1990, c. E.2. Toronto, ON: Queen’s Printer for Ontario, 1990.
Education Quality and Accountability Office (EQAO). Contextual Information. Toronto, ON: EQAO, 2016.
Expert Panel on the Learning Opportunities Grant. Learning Opportunities Grant: Panel Report to Minister of Education and Training . Toronto, ON: Government of Ontario, 1997.
Farb, Amy Feldman and Jennifer L. Matjasko. “Recent Advances in Research on School-Based Extracurricular Activities and Adolescent Development.” Developmental Review 32, no. 1 (2012): 1-48.
Faulkner, Guy E.J., John J.M. Dwyer, Hyacinth Irving, Kenneth R. Allison, Edward M. Adlaf, and Jack Goodman. “Specialist or Nonspecialist Physical Education Teachers in Ontario Elementary Schools: Examining Differences in Opportunities for Physical Activity.” The Alberta Journal of Educational Research 54, no. 4 (2008): 407-19.
Feldman, Amy F. and Jennifer L. Matjasko, “The Role of School-Based Extracurricular Activities in Adolescent Development: A Comprehensive Review and Future Directions.” Review of Educational Research 75, no. 2 (2005): 159-210.
Ferguson, Bruce and Keith Power. “Broader Measures of Success: Physical and Mental Health in Schools.” Measuring What Matters (Toronto, ON: People for Education, November 8, 2014), 6-7.
Fullan, Michael and Maria Langworthy. A Rich Seam: How New Pedagogies Find Deep Learning. London, UK: Pearson, 2014.
Gallagher-Mackay, Kelly, Annie Kidder, and Suzanne Methot. First Nations, Métis and Inuit Education: Overcoming Gaps in Provincially Funded Schools. Toronto, ON: People for Education, 2013.
Government of Ontario. The Journey Together: Ontario’s Commitment to Reconciliation with Indigenous Peoples. Toronto, ON: Queen’s Printer for Ontario, 2016.
Government of Ontario. “News Release—Ontario helping more schools become Community Hubs—Province investing in schools to better serve communities.” Government of Ontario Newsroom. Toronto, ON: Government of Ontario, May 6, 2016.
Government of Ontario. “News Release—Ontario Proclaims First Week of November Treaties Recognition Week—Province Working with Indigenous Partners to Build Awareness.” Government of Ontario Newsroom. Toronto, ON: Government of Ontario, May 30, 2016.
Government of Ontario. Open Minds, Healthy Minds: Ontario’s Comprehensive Mental Health and Addictions Strategy. Toronto, ON: Queen’s Printer for Ontario, June 2011.
Guo, Huijie and David R. Johnson. Unfair Advantage? School Fundraising Capabilities and Student Results. Toronto, ON: C.D. Howe Institute, 2017.
Hamlin, Daniel, David Hagen Cameron, and Elyse Watkins. Ontario’s Guidance Counsellors: Spread Thinly in an Environment of Growing Expectations. Toronto, ON: People for Education, March 7, 2016.
Hartmann, Norbert. Overview of Student-Focused Funding in 2000-01. Memorandum to Directors of Education, March 9, 2000.
Hou, Feng and Aneta Bonikowska. Educational and Labour Market Outcomes of Childhood Immigrants by Admission Class. Statistics Canada Catalogue no. 11F0019M — No. 377. Ottawa, ON: Statistics Canada, April 25, 2016.
Hou, Feng and Qi Zhang. Regional Differences in the Educational Outcomes of Young Immigrants. Statistics Canada Catalogue no. 75-006-X. Ottawa, ON: Statistics Canada, November 18, 2015.
“Inflation Calculator.” Bank of Canada. Accessed March 30, 2017.
“Innovative Programs and Services.” Éducation en langue française en Ontario. Accessed March 2, 2017.
Kasperski, Jan. Issue Brief: Psychology in Education. Toronto, ON: Ontario Psychology Association, April, 2016.
Kokai, Maria and Debra Lean. Response to People for Education Reports Regarding Access to Psychological Services, Guidance Services and De-streaming Grade 9 . Letter, Toronto: ON, October 26, 2015.
MacKenzie, Hugh. Turning Point? Time to Renovate Ontario’s Education Funding Formula. Ottawa, ON: Canadian Centre for Policy Alternatives, 2006.
Murphy, Joseph, Marsha Weil, Philip Hallinger, and Alexis Mitman. “Academic press: Translating high expectations into school policies and classroom practices.” Educational Leadership 40 (December 1982): 22-7.
Nardozi, Angela and Angela Mashford-Pringle. “Engaging Teacher Candidates about Aboriginal Education Perspectives in Ontario.” First Nations Perspectives 6, no. 1 (2014): 52-66.
National Centre for Chronic Disease Prevention and Health Promotion. Health and Academic Achievement. Atlanta, GA: Centers for Disease Control and Prevention, 2014.
Oberg, Dianne. Ignoring the Evidence: Another Decade of Decline for School Libraries. Toronto, ON: Canadian Education Association, 2015.
Office of the Auditor General of Ontario. 2016 Annual Report Volume 2. Toronto, ON: Queen’s Printer for Ontario, 2016.
Ontario Ministry of Education. 2015-16 Education Funding: Consultation Summary. Toronto, ON: Government of Ontario, 2015.
Ontario Ministry of Education. 2016-17 Education Funding: A Guide to the Special Education Grant. Toronto, ON: Queen’s Printer for Ontario, 2016.
Ontario Ministry of Education. 21st Century Competencies: Foundation Document for Discussion. Toronto, ON: Queen’s Printer for Ontario, 2015.
Ontario Ministry of Education. Achieving Excellence: A Renewed Vision for Education in Ontario. Toronto, ON: Queen’s Printer for Ontario, 2014.
Ontario Ministry of Education. Creating Pathways to Success: An Education and Career/Life Planning Program for Ontario Schools. Toronto, ON: Queen’s Printer, 2013.
Ontario Ministry of Education. Education Funding: Technical Paper, 2005-06. Toronto, ON: Government of Ontario, 2005.
Ontario Ministry of Education. Education Funding: Technical Paper, 2006-07. Toronto, ON: Government of Ontario, 2006 .
Ontario Ministry of Education. Education Funding: Technical Paper, 2007-08. Toronto, ON: Government of Ontario, 2007.
Ontario Ministry of Education. Education Funding: Technical Paper, 2008-09. Toronto, ON: Government of Ontario, 2008.
Ontario Ministry of Education. Education Funding: Technical Paper, 2009-10. Toronto, ON: Government of Ontario, 2009.
Ontario Ministry of Education. Education Funding: Technical Paper, 2010-11. Toronto, ON: Government of Ontario, 2010.
Ontario Ministry of Education. Education Funding: Technical Paper, 2011-12. Toronto, ON: Government of Ontario, 2011.
Ontario Ministry of Education. Education Funding: Technical Paper, 2012-13. Toronto, ON: Government of Ontario, 2012.
Ontario Ministry of Education. Education Funding: Technical Paper, 2013-14. Toronto, ON: Government of Ontario, 2013.
Ontario Ministry of Education. Education Funding: Technical Paper, 2014-15. Toronto, ON: Government of Ontario, 2014.
Ontario Ministry of Education. Education Funding: Technical Paper, 2015-16. Toronto, ON: Government of Ontario, 2015.
Ontario Ministry of Education. Education Funding: Technical Paper, 2016-17. Toronto, ON: Government of Ontario, 2016.
Ontario Ministry of Education. Education Funding: Technical Paper, 2017-18. Toronto, ON: Government of Ontario, 2017.
Ontario Ministry of Education. English Language Learners, ESL and ELD Programs and Services: Policies and Procedures for Ontario Elementary and Secondary Schools, Kindergarten to Grade 12. Toronto, ON: Queen’s Printer for Ontario, 2007.
Ontario Ministry of Education. Fees for Learning Materials and Activities Guideline. Toronto, ON: Government of Ontario, 2011.
Ontario Ministry of Education. Guideline for School Fundraising. Toronto, ON: Government of Ontario, 2012.
Ontario Ministry of Education. Implementation Plan: Ontario First Nations, Métis, and Inuit Education Policy Framework. Toronto, ON: Queen’s Printer for Ontario, 2014.
Ontario Ministry of Education. The Ontario Curriculum: The Arts (Grades 1-8). Toronto, ON: Queen’s Printer for Ontario, 2009.
Ontario Ministry of Education. The Ontario Curriculum, Grades 9 to 12: Course Descriptions and Prerequisites. Toronto, ON: Queen’s Printer for Ontario, 2011.
Ontario Ministry of Education. The Ontario Curriculum: Health and Physical Education (Grades 1—8). Toronto, ON: Queen’s Printer for Ontario, 2015.
Ontario Ministry of Education. The Ontario Curriculum: Social Studies (Grades 1 to 6), History and Geography (Grades 7 and 8). Toronto, ON: Queen’s Printer for Ontario, 2013.
Ontario Ministry of Education. Ontario First Nation, Métis, and Inuit Education Policy Framework. Toronto, ON: Queen’s Printer for Ontario, 2007.
Ontario Ministry of Education. Ontario’s Well-Being Strategy For Education: Discussion Document. Toronto, ON: Queen’s Printer for Ontario, 2016.
Ontario Ministry of Education. Standards for School Boards’ Special Education Plans. Toronto, ON: Government of Ontario, 2000.
Ontario School Library Association. Together for Learning: School Libraries and the Emergence of the Learning Commons. Toronto, ON: Ontario School Library Association, 2010.
Ontario Student Trustees’ Association (OSTA). OSTA-AECO Student and Parent Survey—Analysis and Results. Toronto, ON: OSTA, People for Education, Student Vote, and ScholarshipsCanada.ca, October 21, 2011.
Organization for Economic Cooperation and Development (OECD). Helping Immigrant Students to Succeed at School—And Beyond. Paris, FR: OECD Publishing, 2015.
OECD. PISA 2012 Results: Creative Problem Solving: Students’ Skills in Tackling Real-Life Problems (Volume V). Paris, FR: OECD Publishing, 2014.
People for Education. Annual Report on Ontario’s Publicly Funded Schools 2013. Toronto, ON: People for Education, 2013.
People for Education. Public Education in Ontario’s Cities. Toronto, ON: People for Education, 2005.
People for Education. Reading for Joy. Toronto, ON: People for Education, 2011.
Peterson, Katie and Daniel Hamlin. Career and Life Planning in Schools: Multiple Paths; Multiple Policies; Multiple Challenges. Toronto, ON: People for Education, March 1, 2017.
Pistiolis, Vana. The Results and Implications of Fundraising in Elementary Public Schools: Interviews with Ontario Principals. Doctoral dissertation, University of Toronto, 2012.
Premier’s Community Hub Framework Advisory Group. Community Hubs in Ontario: A Strategic Framework and Action Plan. Toronto, ON: Government of Ontario, 2016.
The Premier’s Highly Skilled Workforce Expert Panel. Building the Workforce of Tomorrow: A Shared Responsibility. Toronto, ON: Queen’s Printer for Ontario, 2016.
Rozanski, Mordechai. Investing in Public Education: Advancing the Goal of Continuous Improvement in Student Learning and Achievement – Report of the Education Equality Task Force, 2002. Toronto, ON: Queen’s Printer for Ontario, 2002.
Saklofske, Donald H., Vicki L. Schwean, R. Bartell, Juanita J.K. Mureika, J. Andrews, Jeffrey Derevensky, and Henry L. Janzen. “School Psychology in Canada: Past, Present, and Future Perspectives.” In School Psychology: Past, Present, and Future edited by Thomas K. Fagan and Paula Sachs Wise, 297-338. Bethesda, MD: National Association of School Psychologists, 2007.
“School Health and Youth Health Promotion.” World Health Organization. Accessed February 16, 2017.
Statistics Canada. 2006 Census Topic-based Tabulations (table), Statistics Canada Catalogue no. 97-555-XCB2006038. Ottawa, ON: Statistics Canada, July 17, 2006.
Statistics Canada. 2011 Census Profile: Language. Ottawa, ON: Statistics Canada, May 31, 2016.
Statistics Canada. 2011 National Household Survey: Data tables (table), Statistics Canada Catalogue no. 99-012-X2011044. Ottawa, ON: Statistics Canada, February 14, 2017.
Statistics Canada. 2011 National Household Survey Highlights: Factsheet 1. Ottawa, ON: Statistics Canada, June 2013.
Telford, Richard D., Ross B. Cunningham, Robert Fitzgerald, Lisa S. Olive, Laurence Prosser, Xiaoli Jiang, and Rohan M. Telford. “Physical education, obesity, and academic achievement: a 2-year longitudinal investigation of Australian elementary school children.” American Journal of Public Health 102, no. 2 (2012): 368-74.
Toulouse, Pamela. Beyond Shadows: First Nations, Métis and Inuit Student Success . Ottawa, ON: Canadian Teachers’ Federation, 2013.
Toulouse, Pamela. What Matters in Indigenous Education: Implementing a Vision Dedicated to Holism, Diversity and Engagement. Toronto, ON: People for Education, 2016.
Truth and Reconciliation Commission of Canada. Honouring the Truth, Reconciling for the Future: Summary of the Final Report of the Truth and Reconciliation Commission of Canada. Winnipeg, MB: National Centre for Truth and Reconciliation—University of Manitoba, 2015.
Truth and Reconciliation Commission of Canada. Truth and Reconciliation Commission of Canada: Calls to Action. Winnipeg, MB: National Centre for Truth and Reconciliation—University of Manitoba, 2015.
United Nations Education, Scientific, and Cultural Organization (UNESCO). Quality Physical Education: Guidelines for Policy Makers. Paris, FR: UNESCO, 2015.
Upitis, Rena. “Creativity: The State of the Domain.” Measuring What Matters. Toronto, ON: People for Education, November 8, 2014.
People for Education is supported by thousands of individual donors, and the work and dedication of hundreds of volunteers. We also receive support from the Atkinson Foundation, the Counselling Foundation of Canada, the Higher Education Quality Council of Ontario, the Laidlaw Foundation, the J.W. McConnell Family Foundation, the O’Neil Foundation, the R. Howard Webster Foundation, and the Ontario Ministry of Education.
Every year, principals in schools across Ontario take the time to complete our survey and share their stories with us. And every year, many volunteer researchers help us put the data we collect from schools into a context that helps us write our reports.
In particular, we thank:
Sophia Ali
Jennifer Barratt-Parker
Daniel Crow
Geoffrey Feldman
Maria Kokai
Debra Lean
Joanne MacEwan
Cathy Philpott
Gregory Querel
Ed Reed
Benjamin Smith
Diane Wagner
and, as always, Dennis
Research Director:
David Hagen Cameron
Data Analyst:
Daniel Hamlin
Researcher and Project Coordinator:
Christine Corso
Research Assistant:
Katie Peterson
Writers:
Sharon Alexander
Christine Corso
Michael Gill
Daniel Hamlin
Annie Kidder
Sara Mison
Irina Ovis
Gillian Parekh
Katie Peterson
Pamela Toulouse
Debbie Weston
Editors:
Annie Kidder
Jacqui Strachan
Layout:
Megan Yeadon
The People for Education tracking survey was developed by People for Education and the Metro Parent Network, in consultation with parents and parent groups across Ontario. People for Education owns the copyright on all intellectual property that is part of this project.
Use of any questions contained in the survey, or any of the intellectual property developed to support administration of the survey, is strictly prohibited without the express written permission of People for Education.
Questions about the use of intellectual property should be addressed to the Research Director, People for Education, at 416-534-0100 or [email protected].
Data from the survey
Specific research data from the survey can be provided for a fee.
Elementary school data have been collected since 1997, and secondary school data have been collected since 2000. Please contact
[email protected].
© People for Education, 2017
People for Education is a registered charity working to support public education in Ontario’s English, French and Catholic schools.
641 Bloor Street West
Toronto, ON M6G 1L1
Phone: 416-534-0100 or 1-888-534-3944
Fax: 416-536-0100
Email: [email protected]
Website: www.peopleforeducation.ca
Document citation
This report should be cited in the following manner:
People for Education. Competing Priorities (Annual Report on Ontario’s Publicly Funded Schools 2017). Toronto, ON: People for Education, 2017.

